Infographics present information visually, combining text, images, and data to convey statistical information, processes, and concepts.
Need help to showcase project or campaign results and impact? Infographics can explain ideas and processes in a way that allows your audiences or customers to understand your data. Powerful infographics transform ideas into understandable, relevant, and interesting visuals for technical and non-technical users alike.
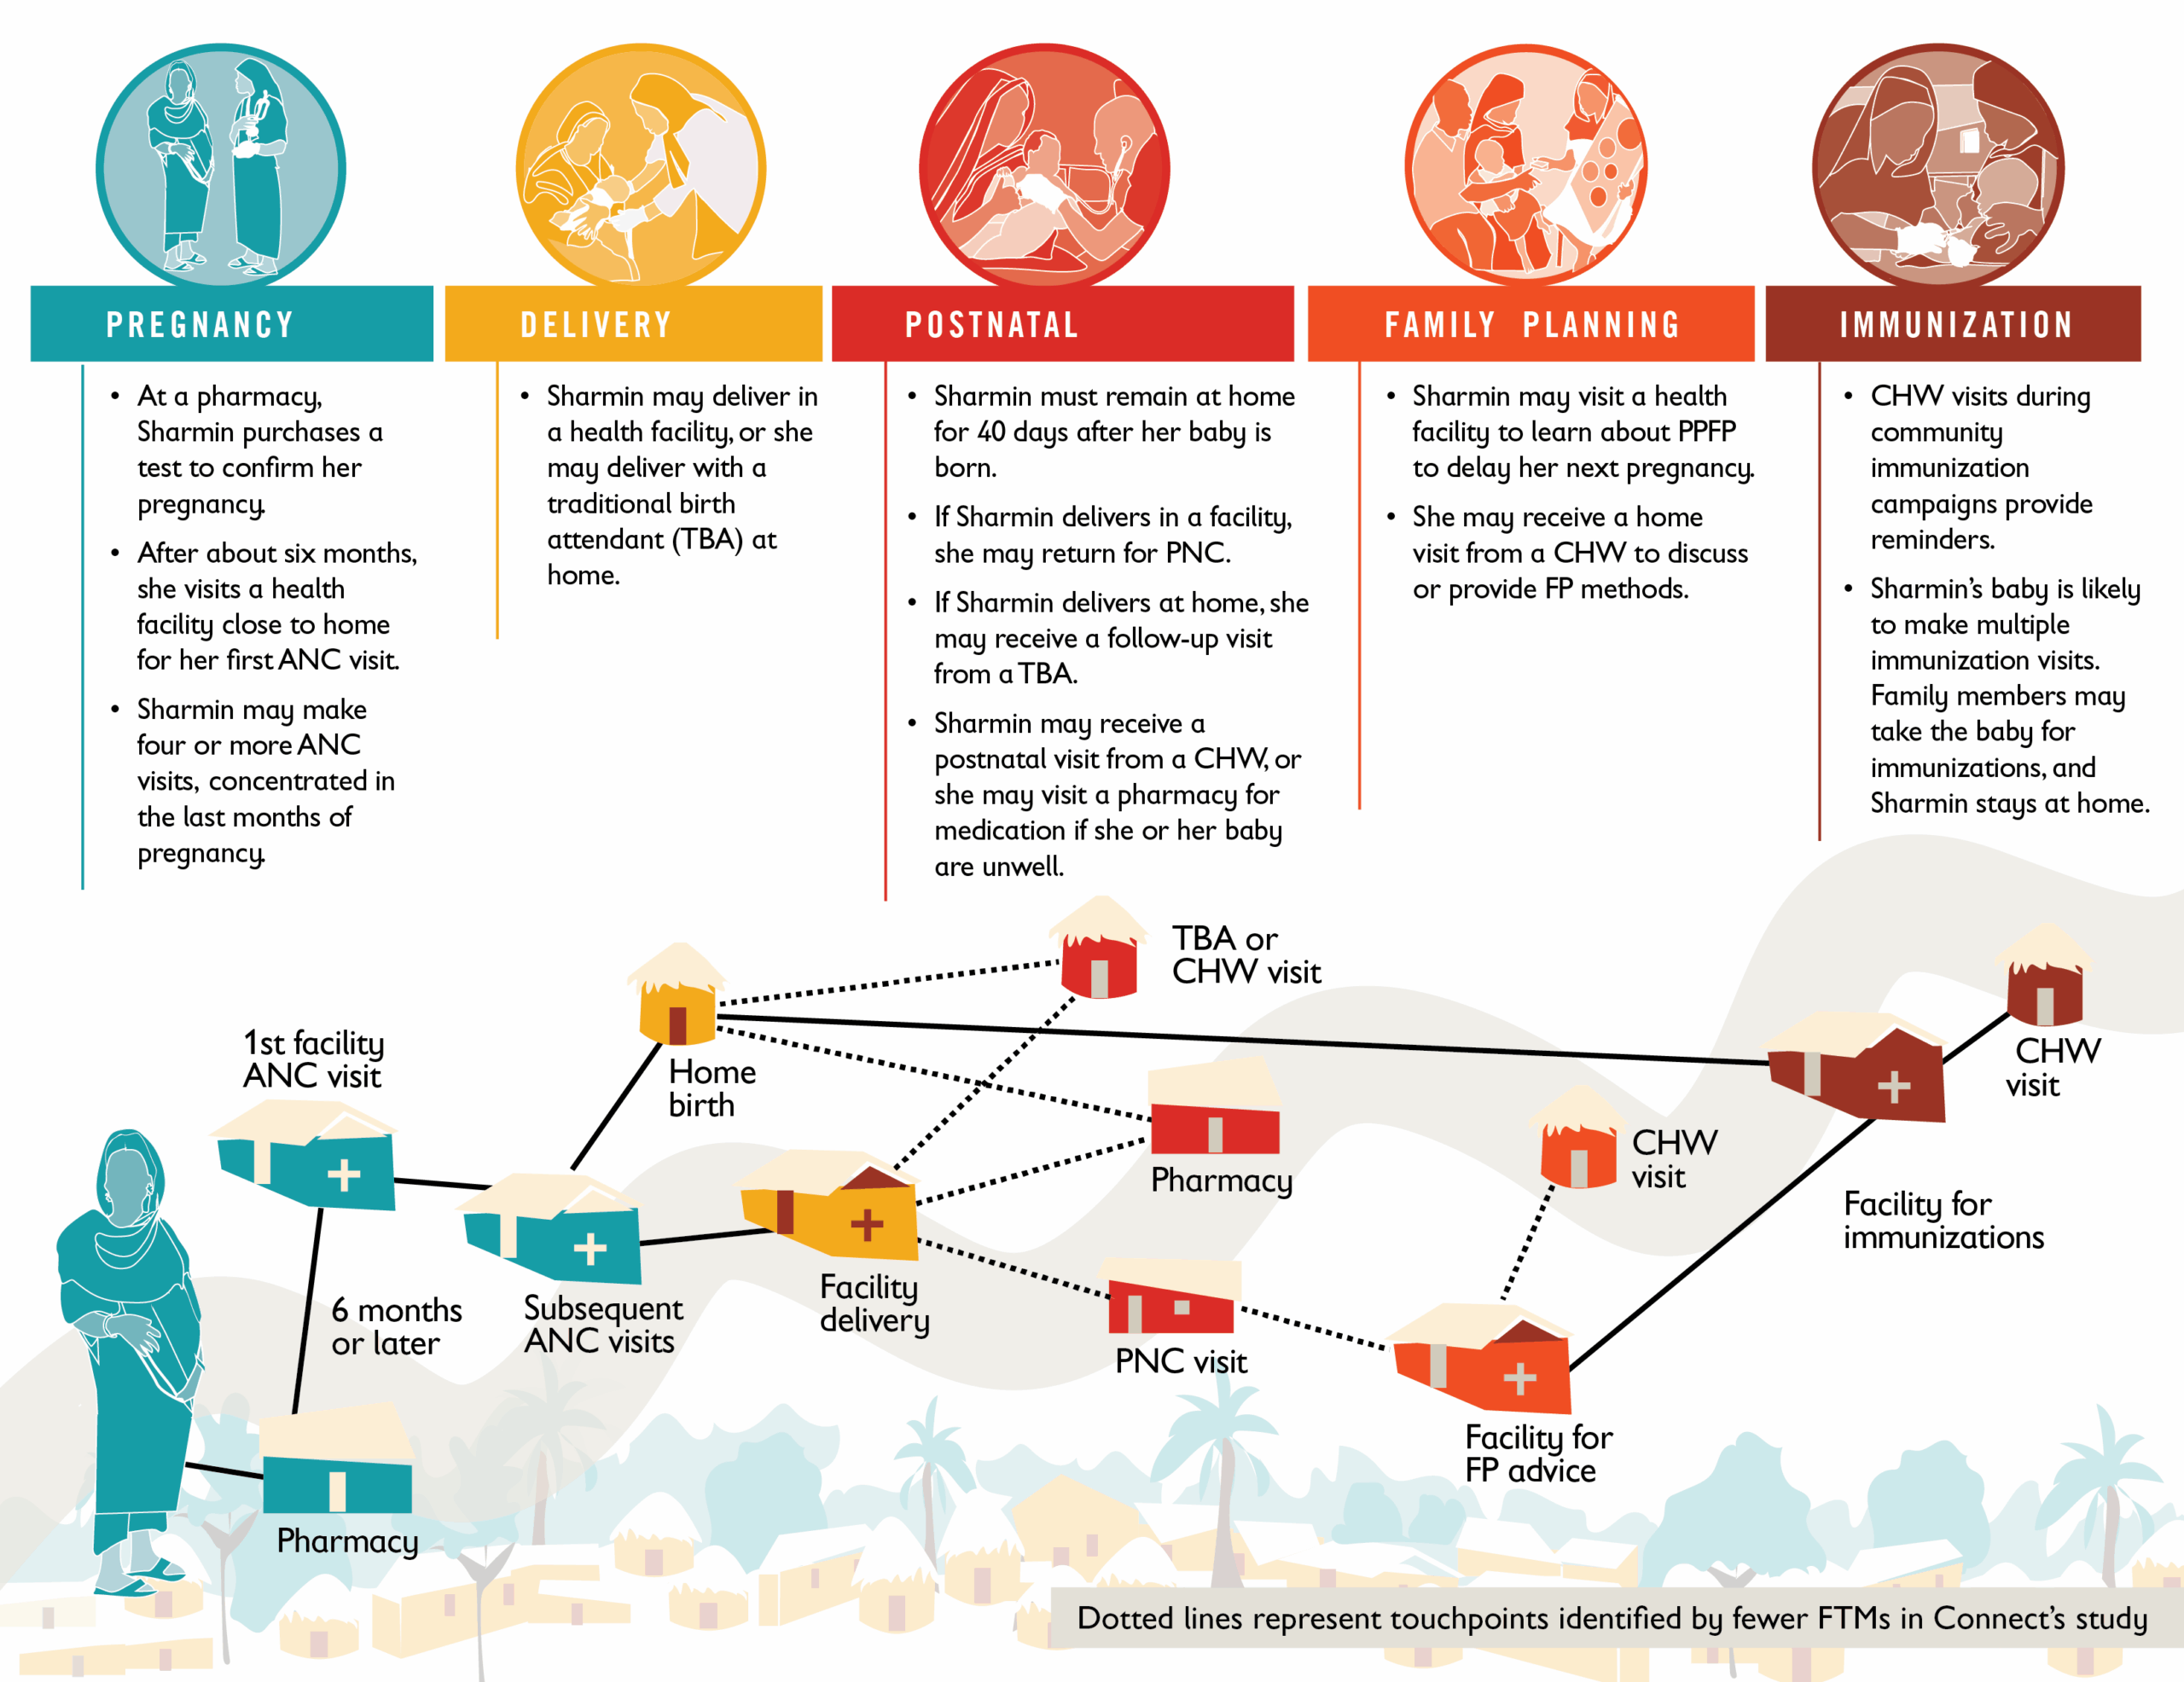
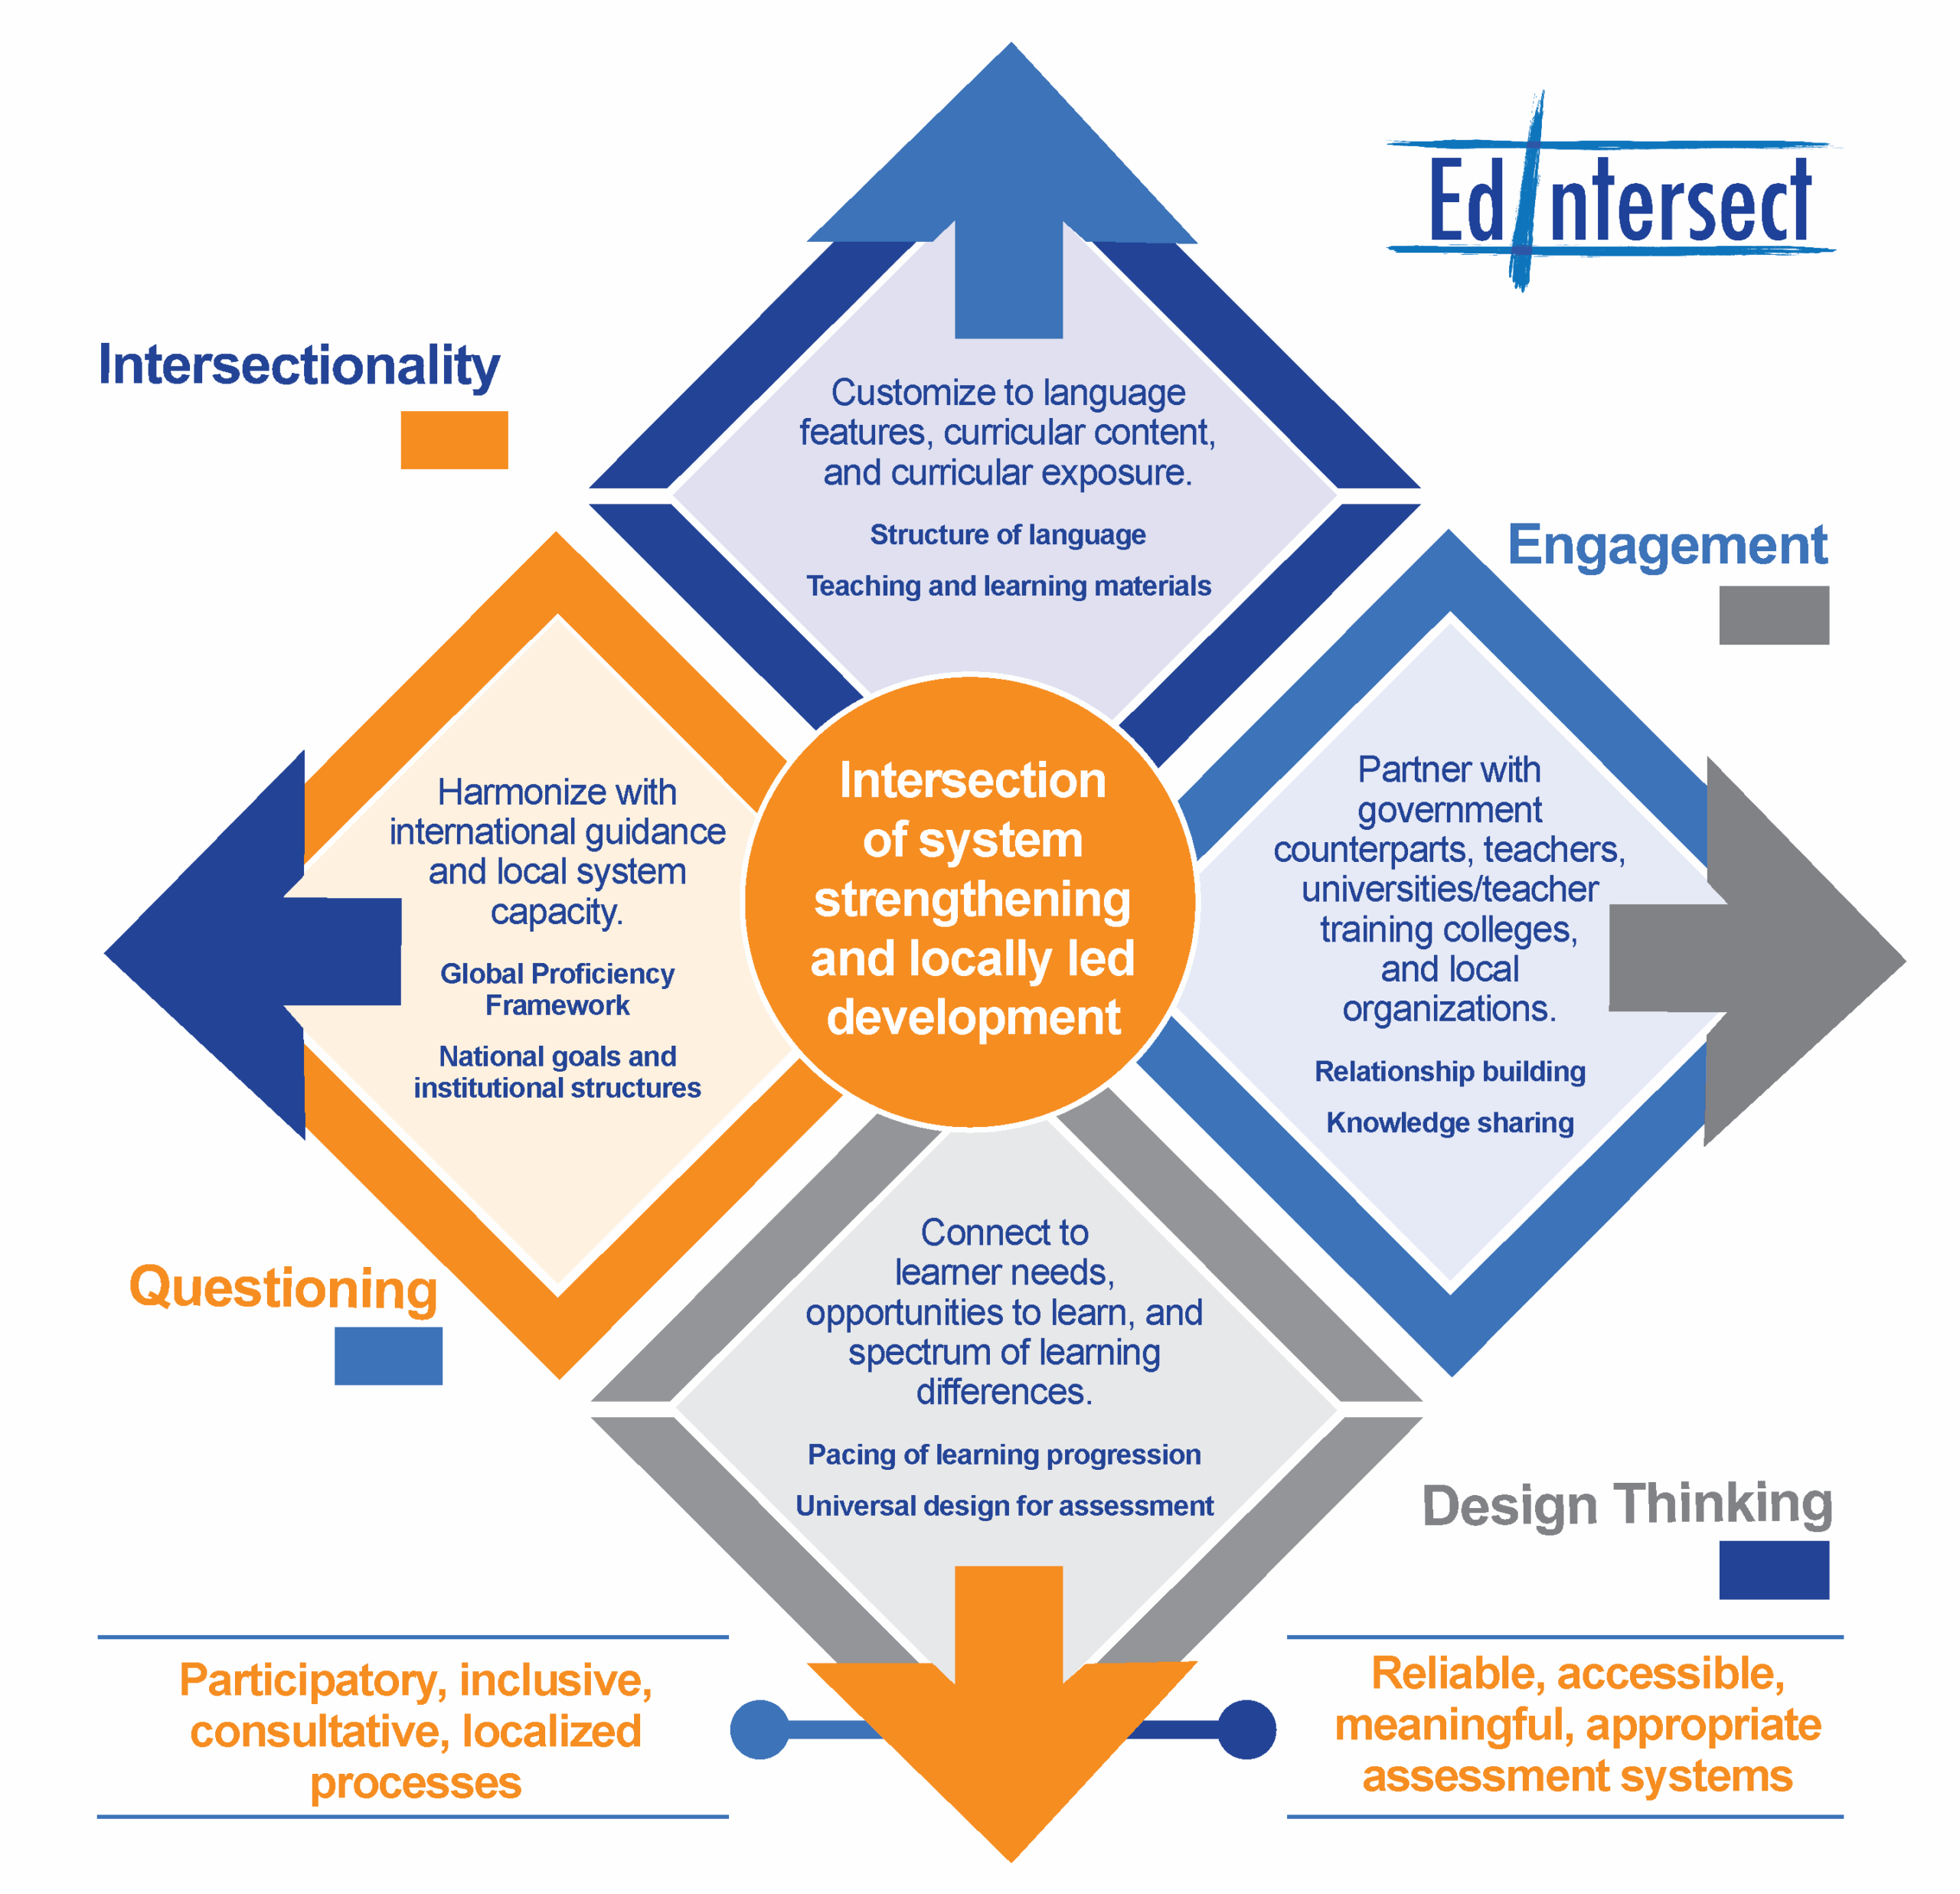
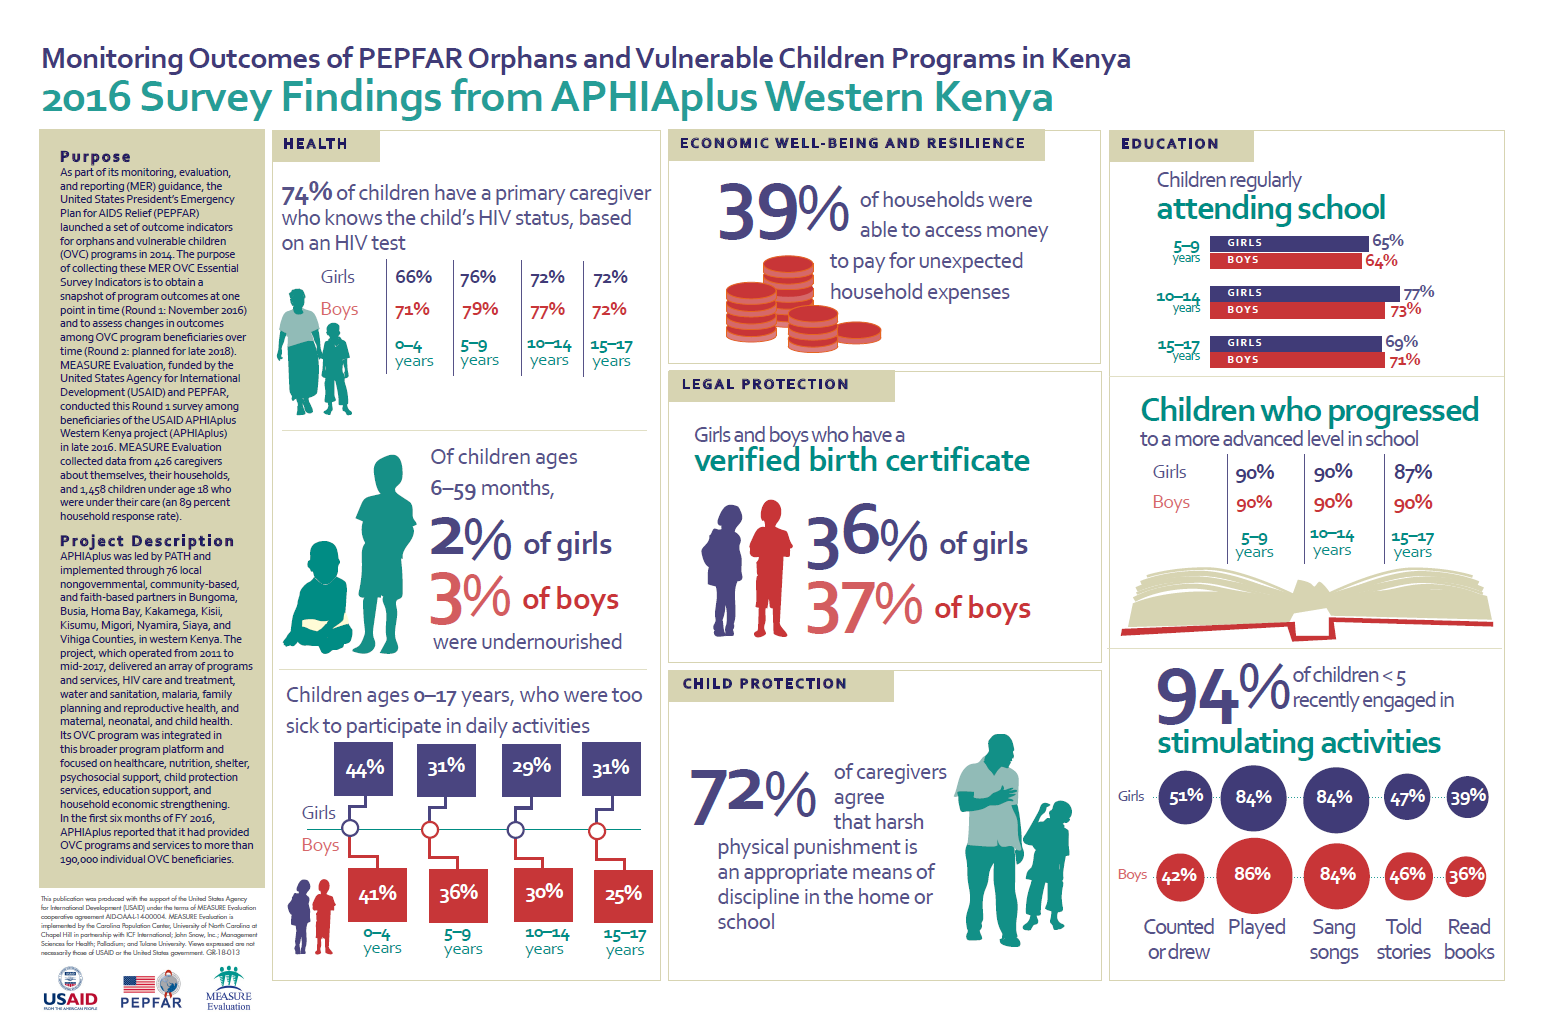
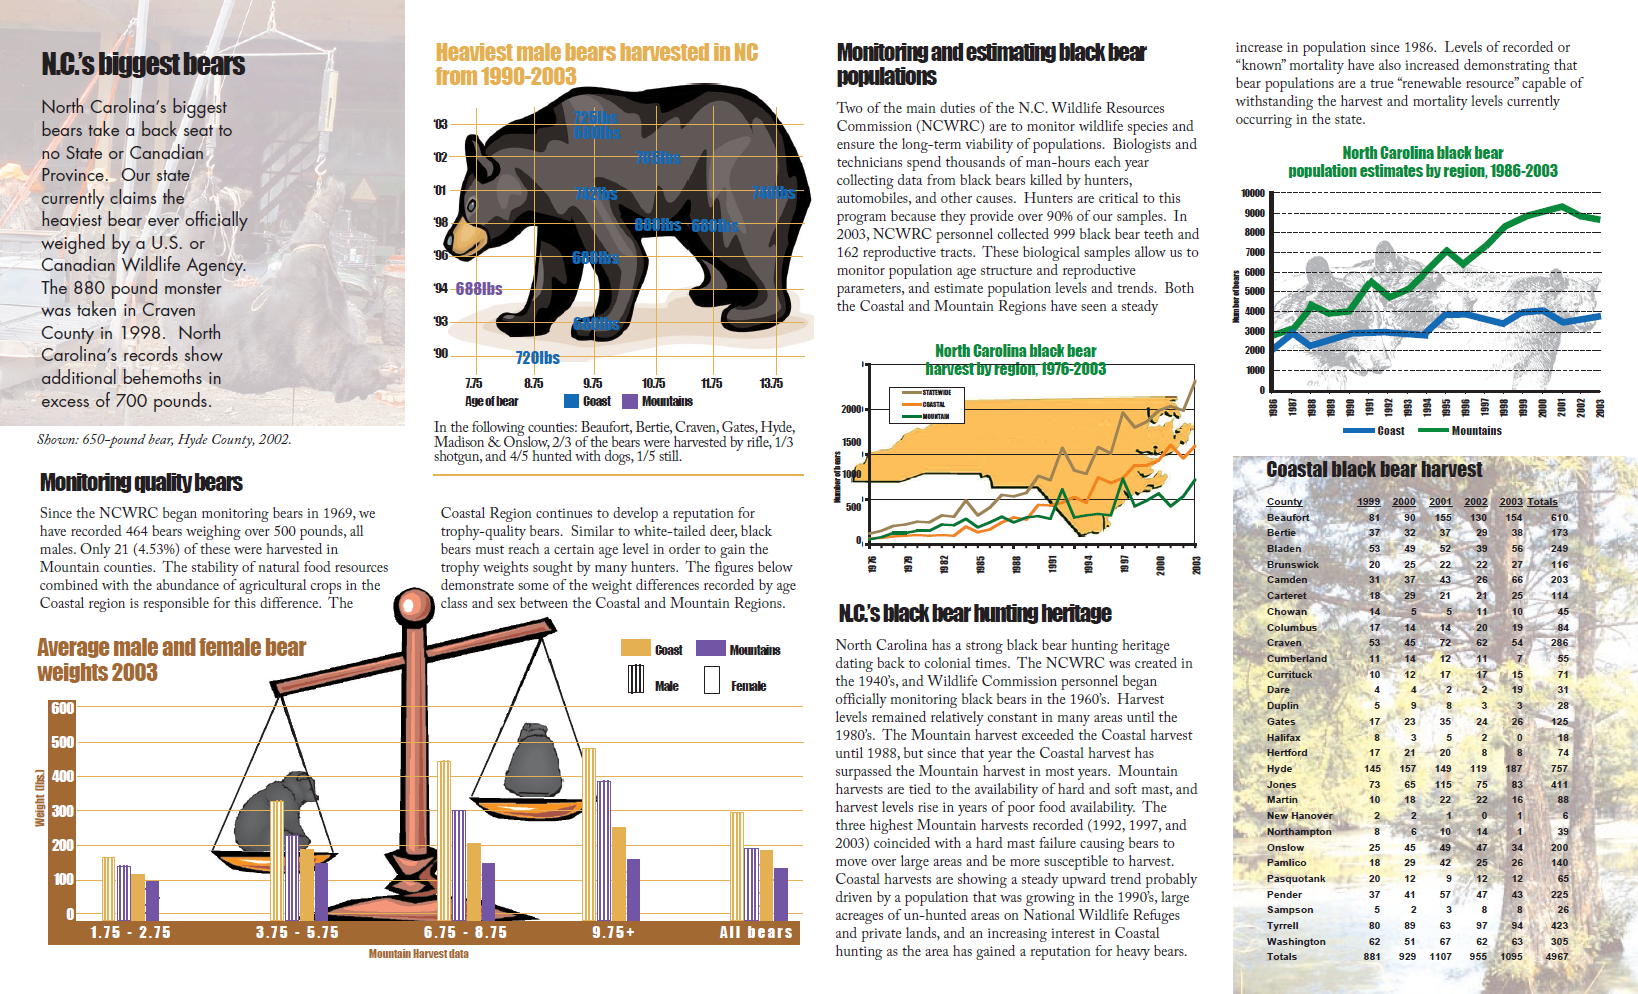
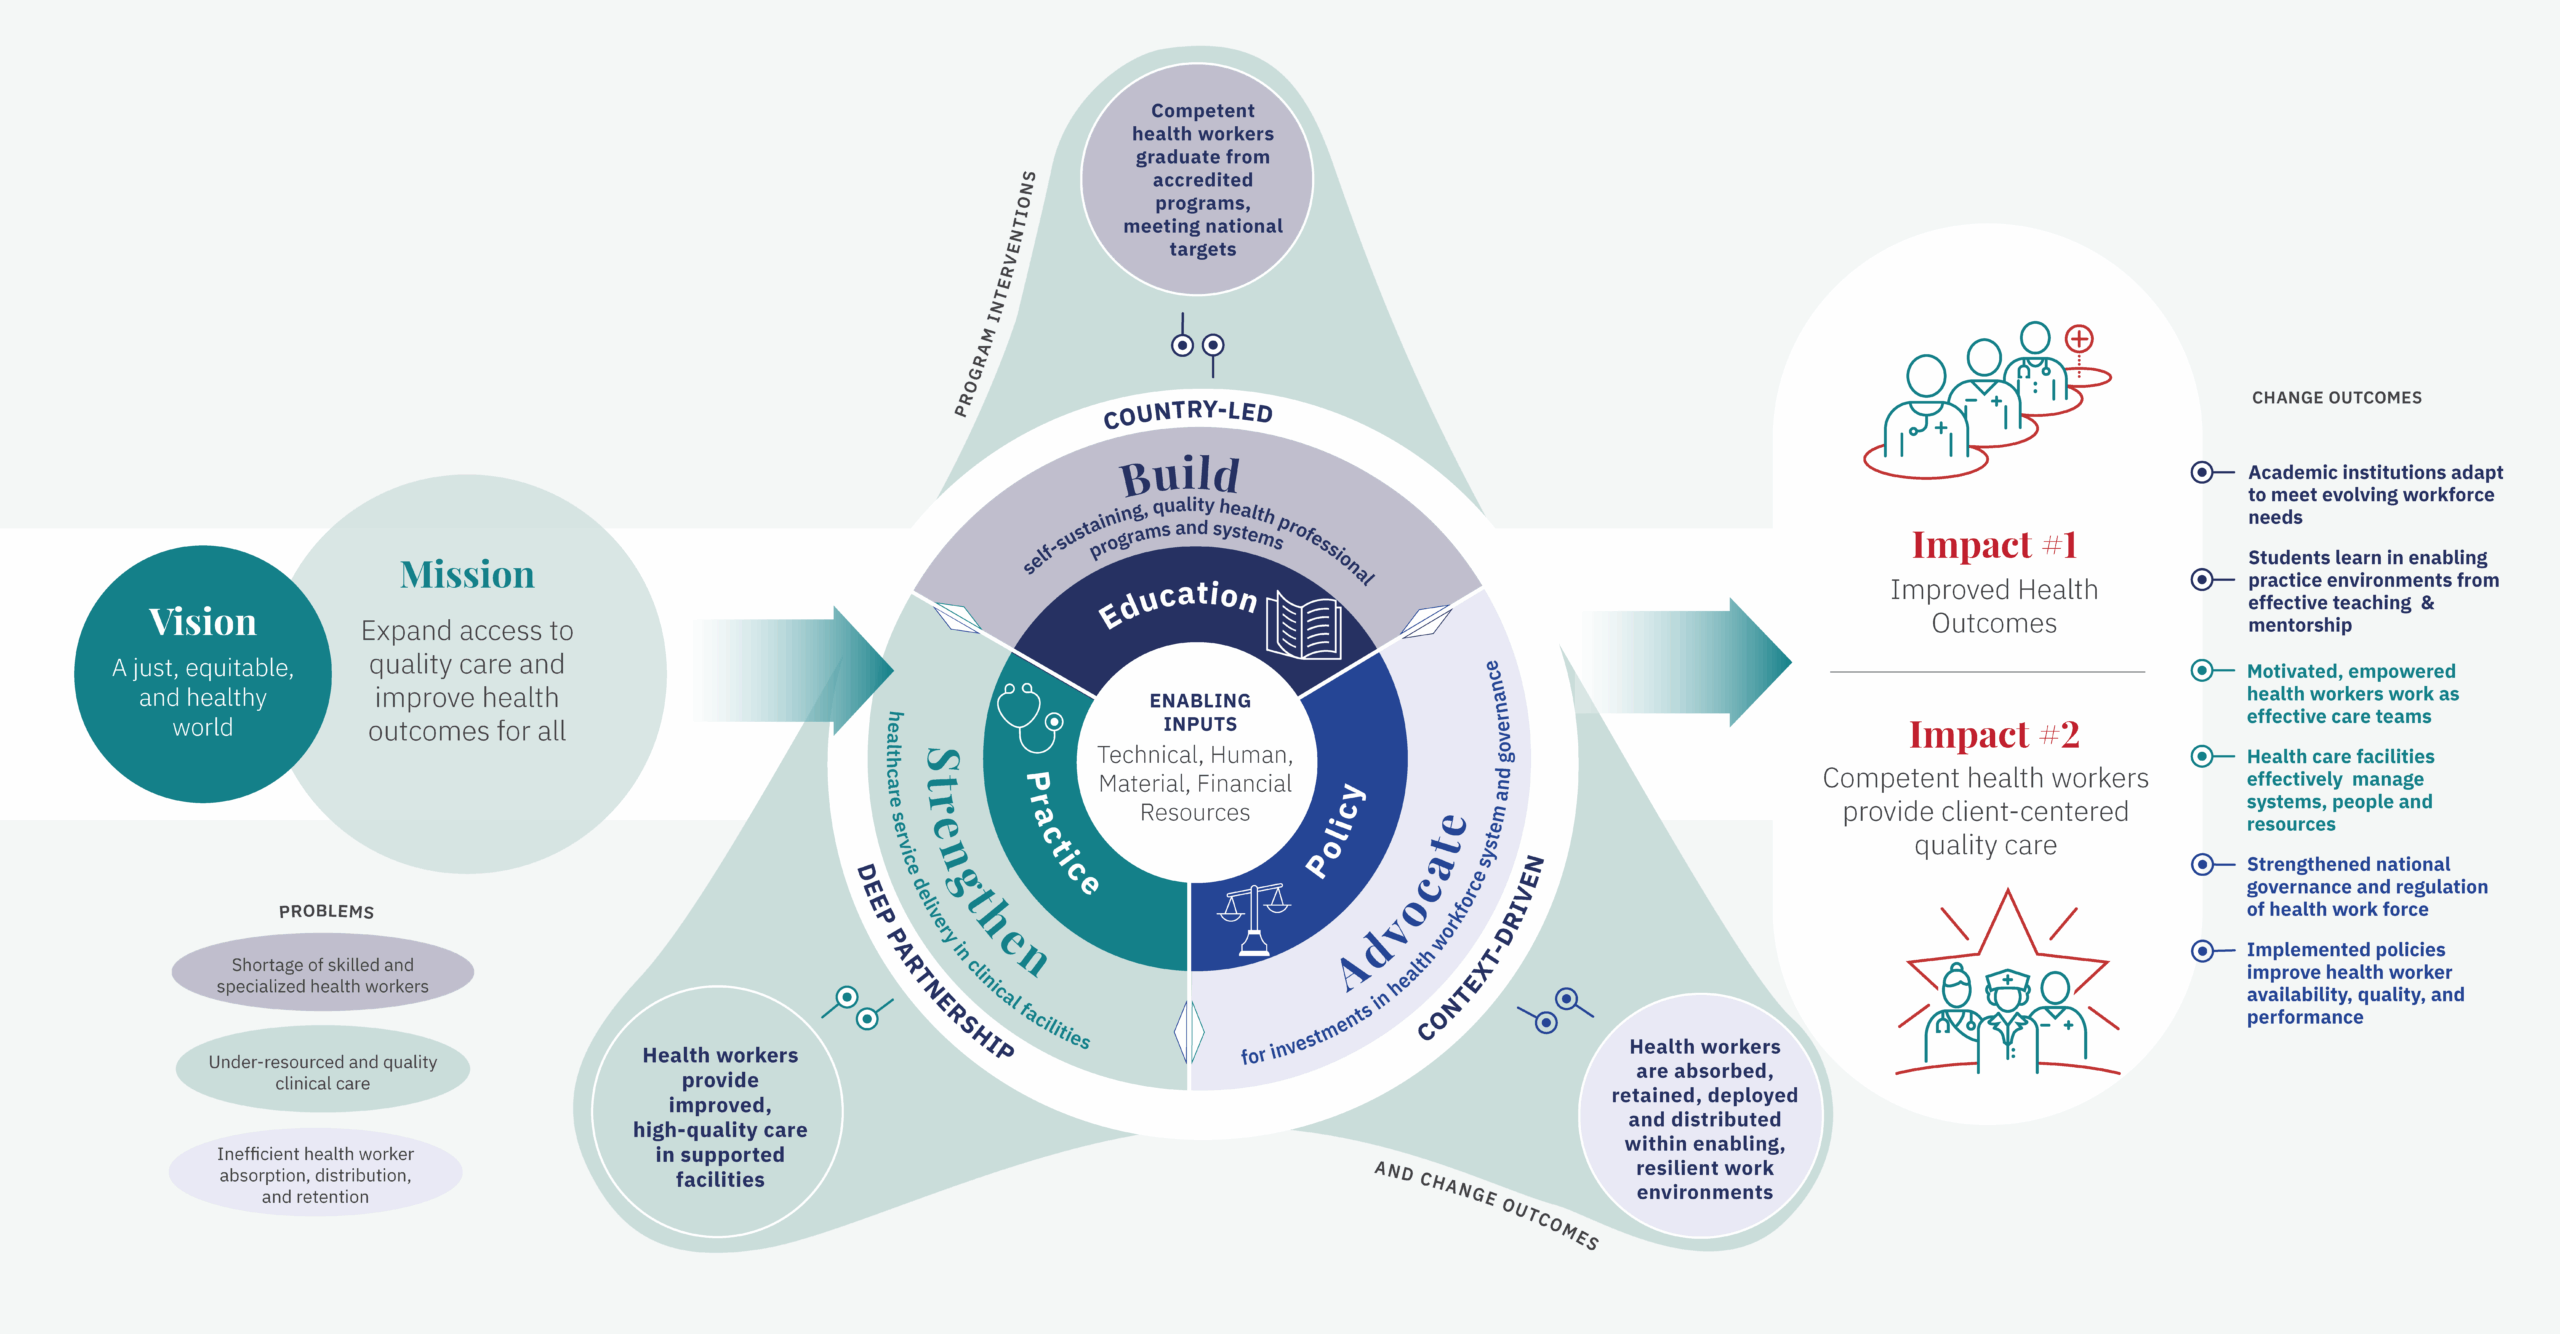
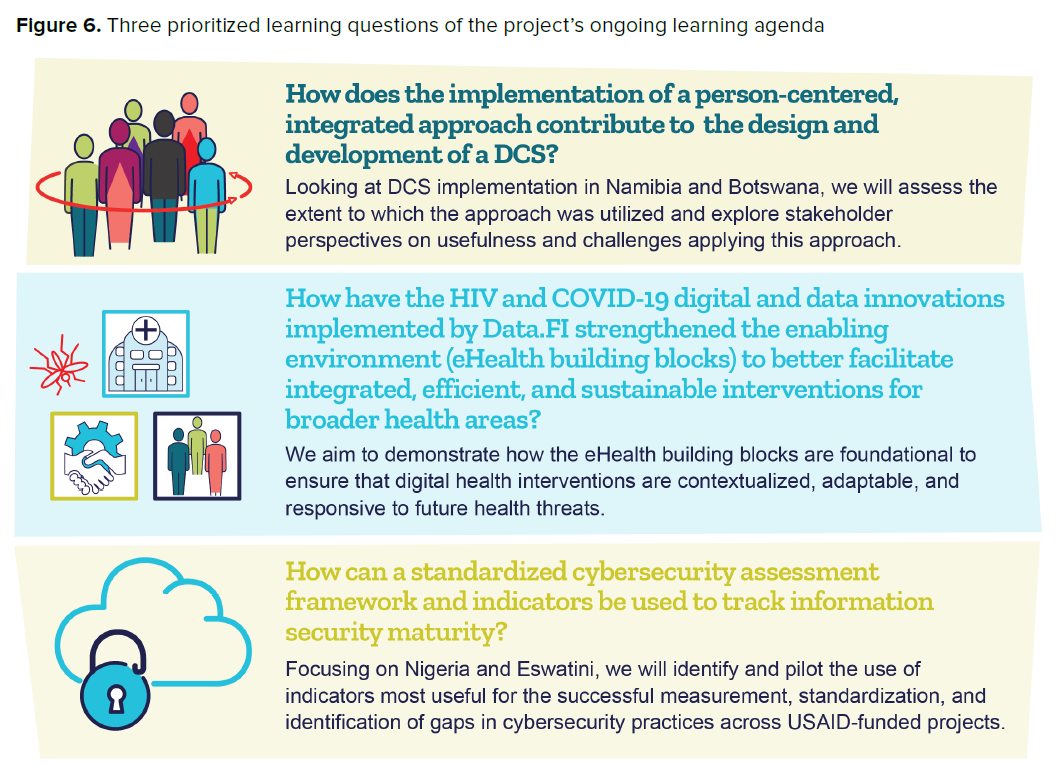
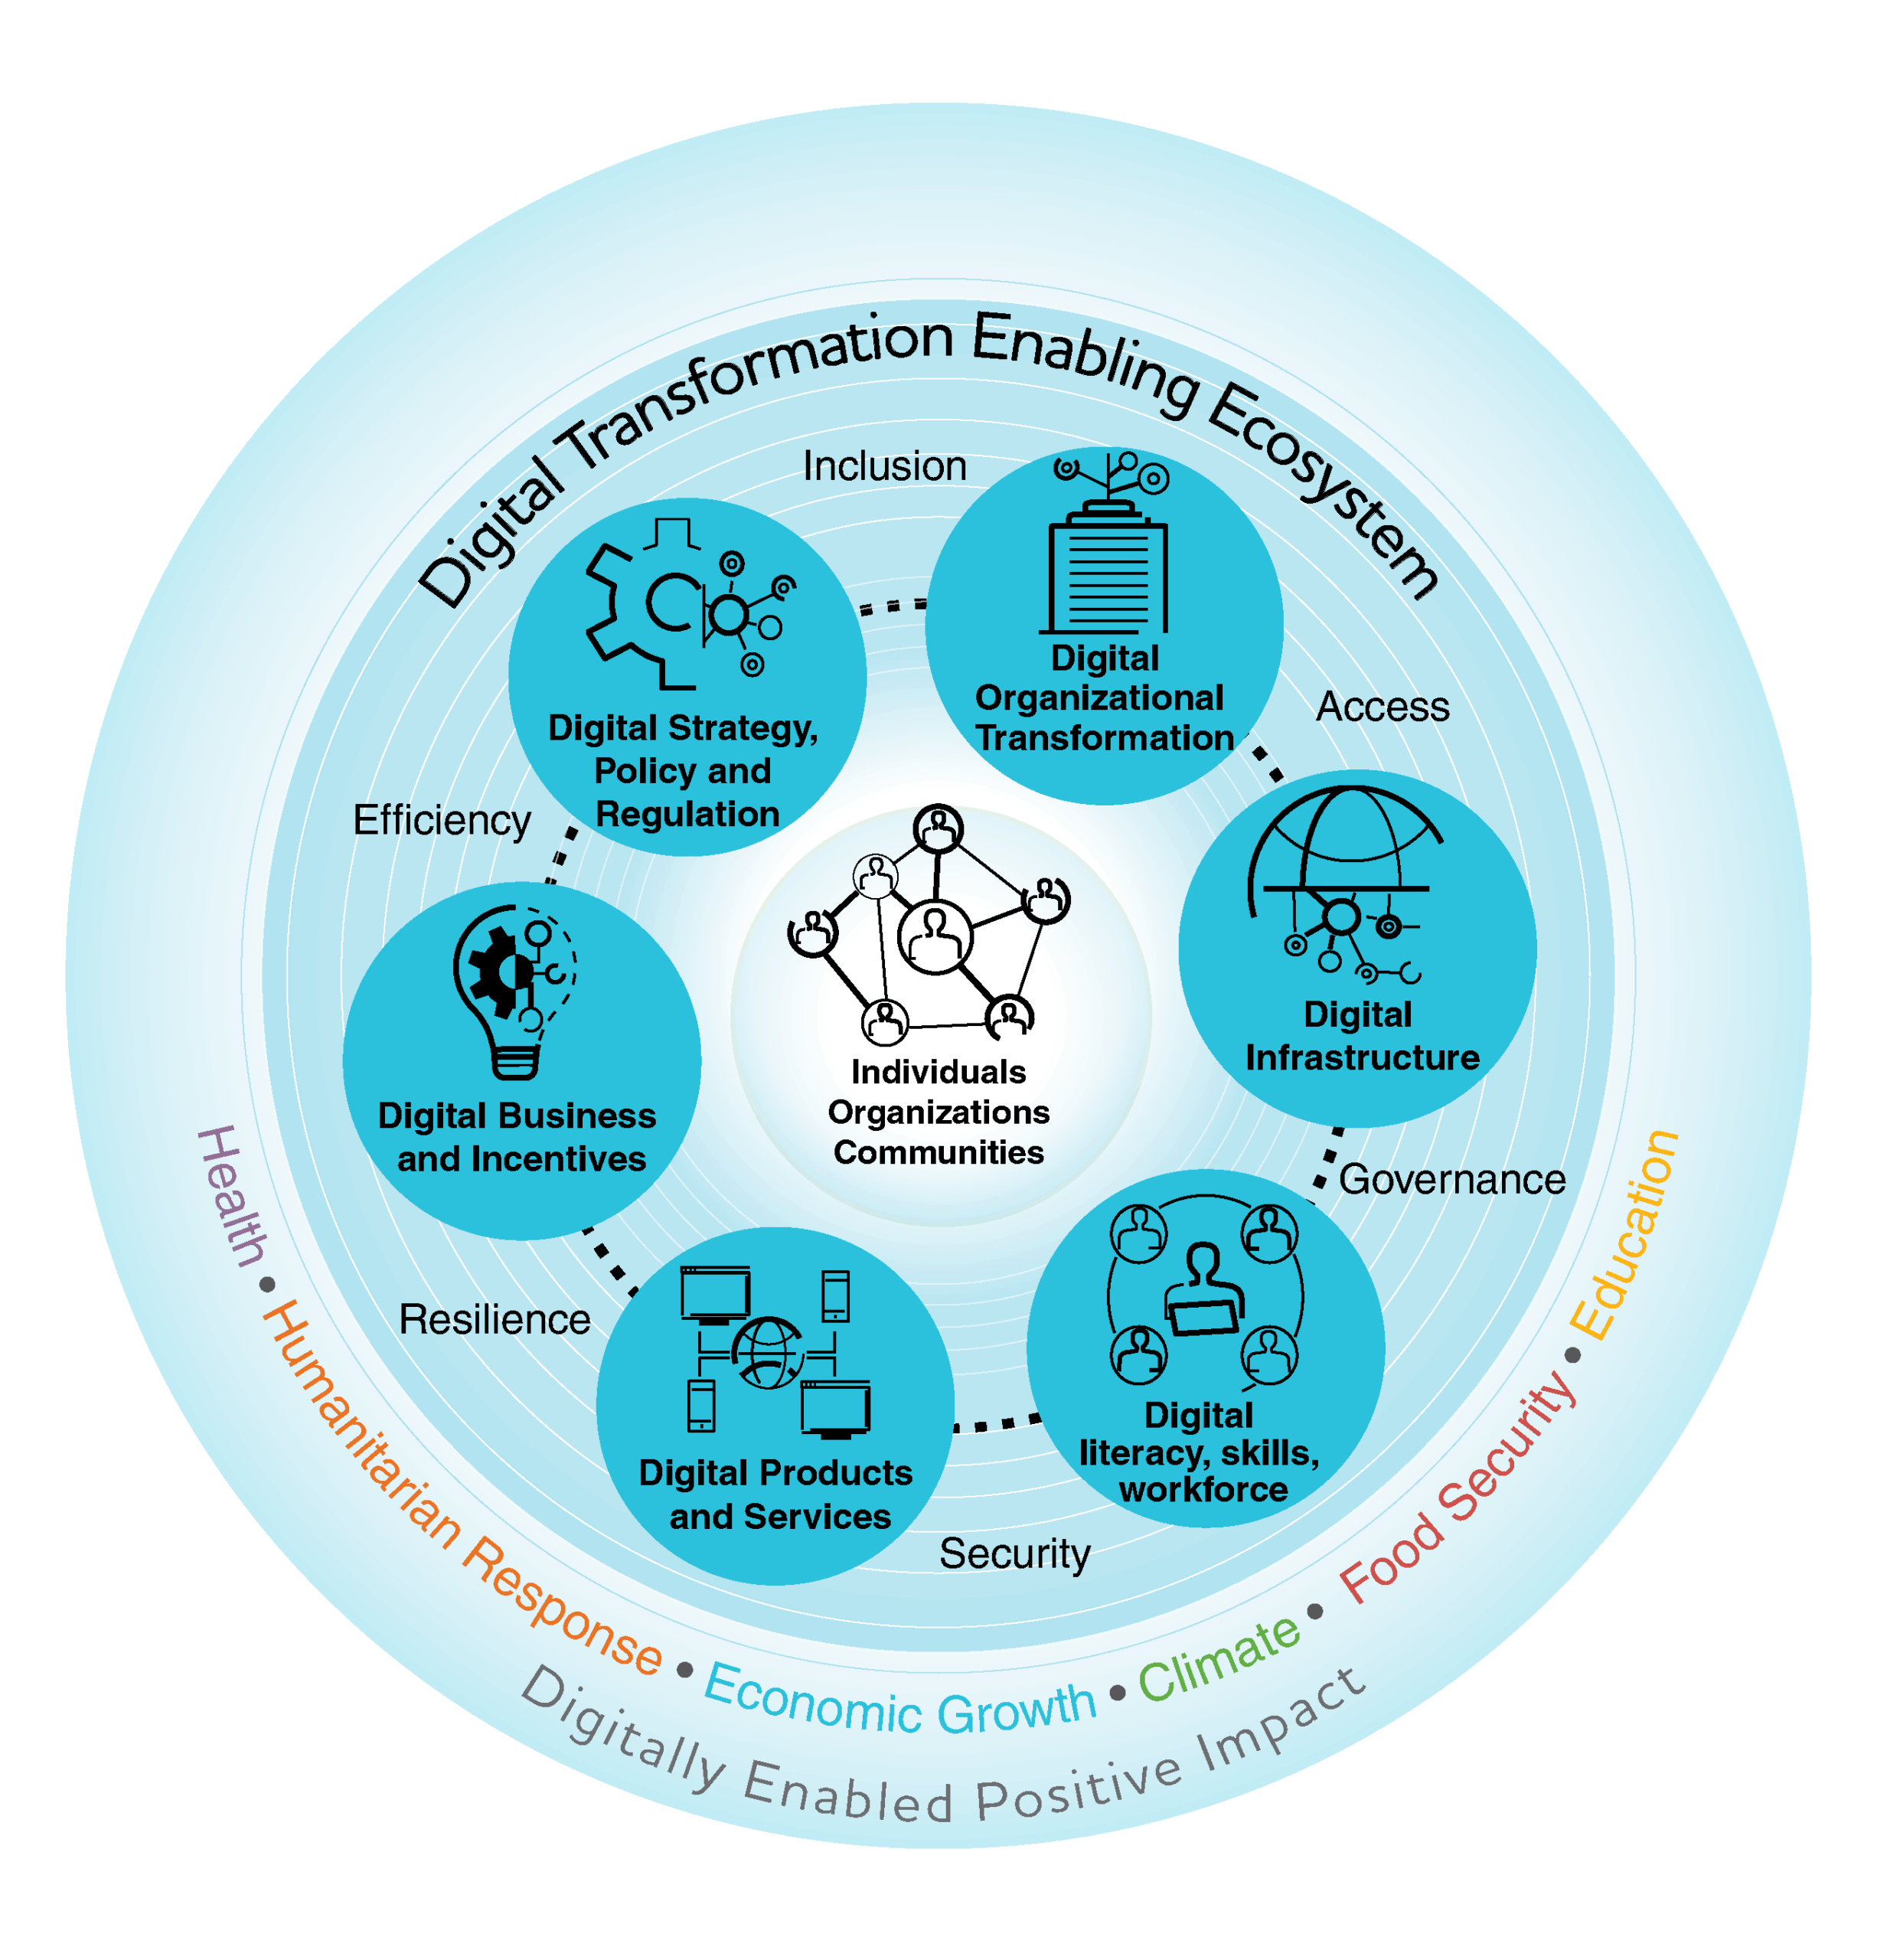
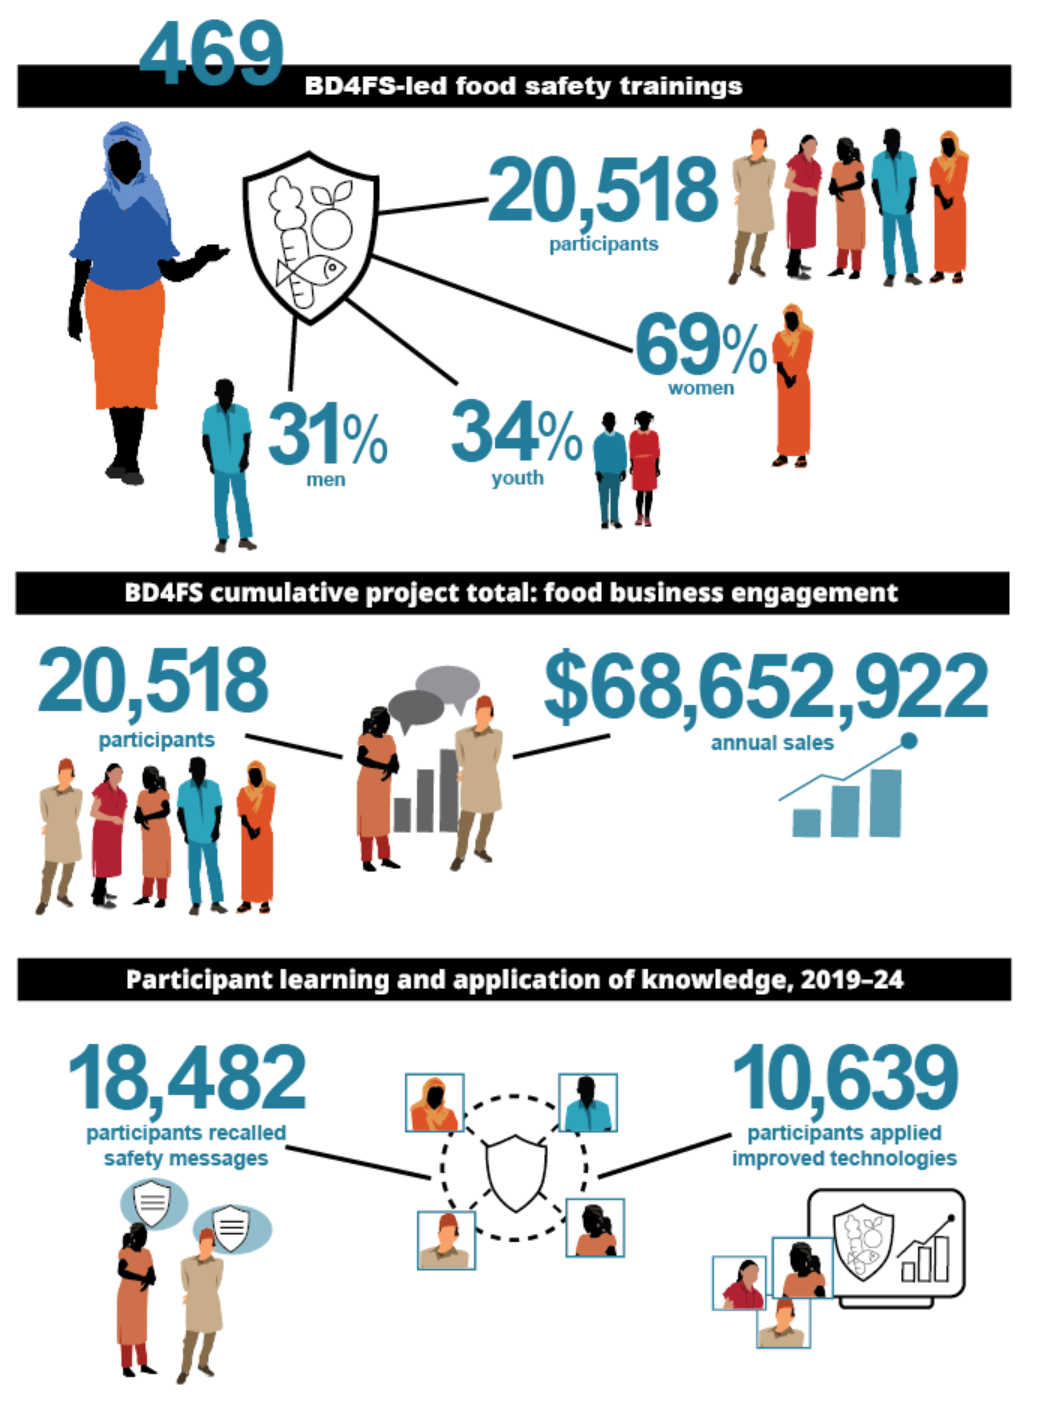
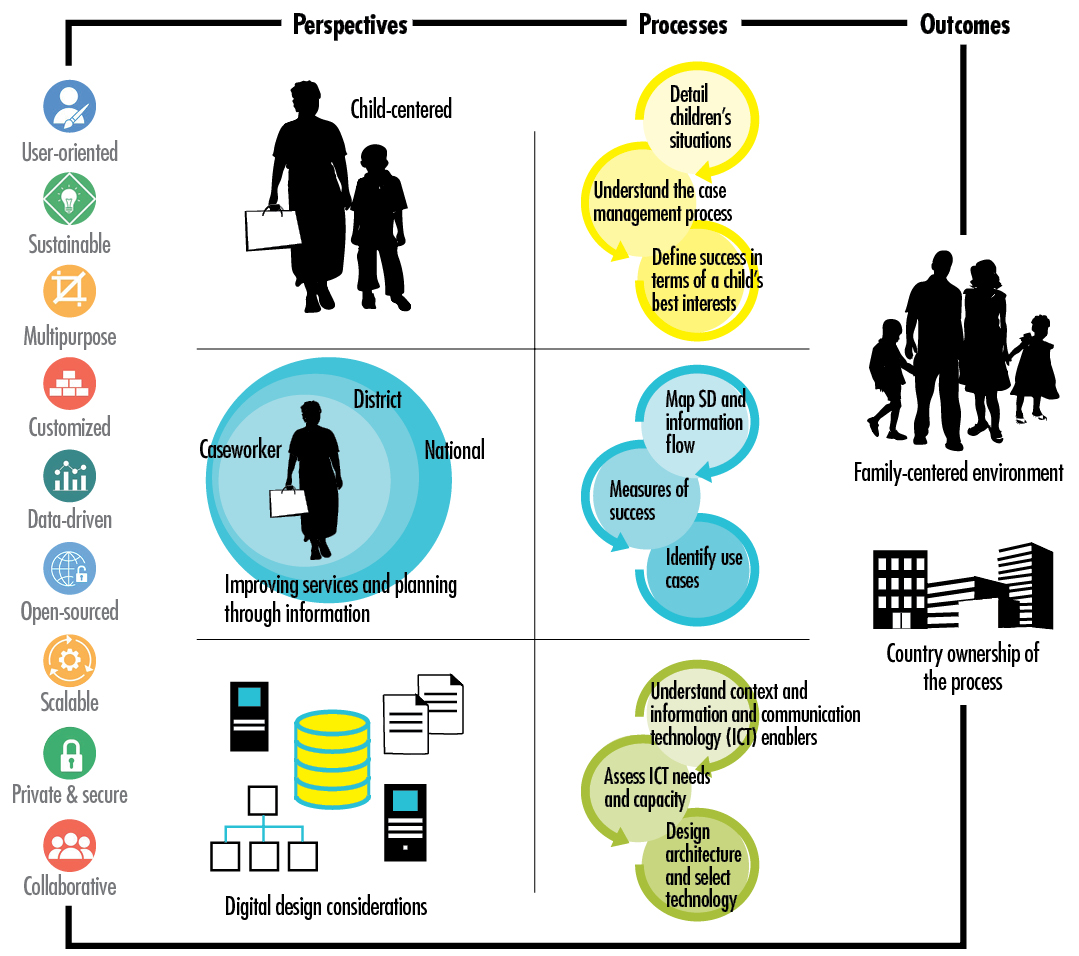
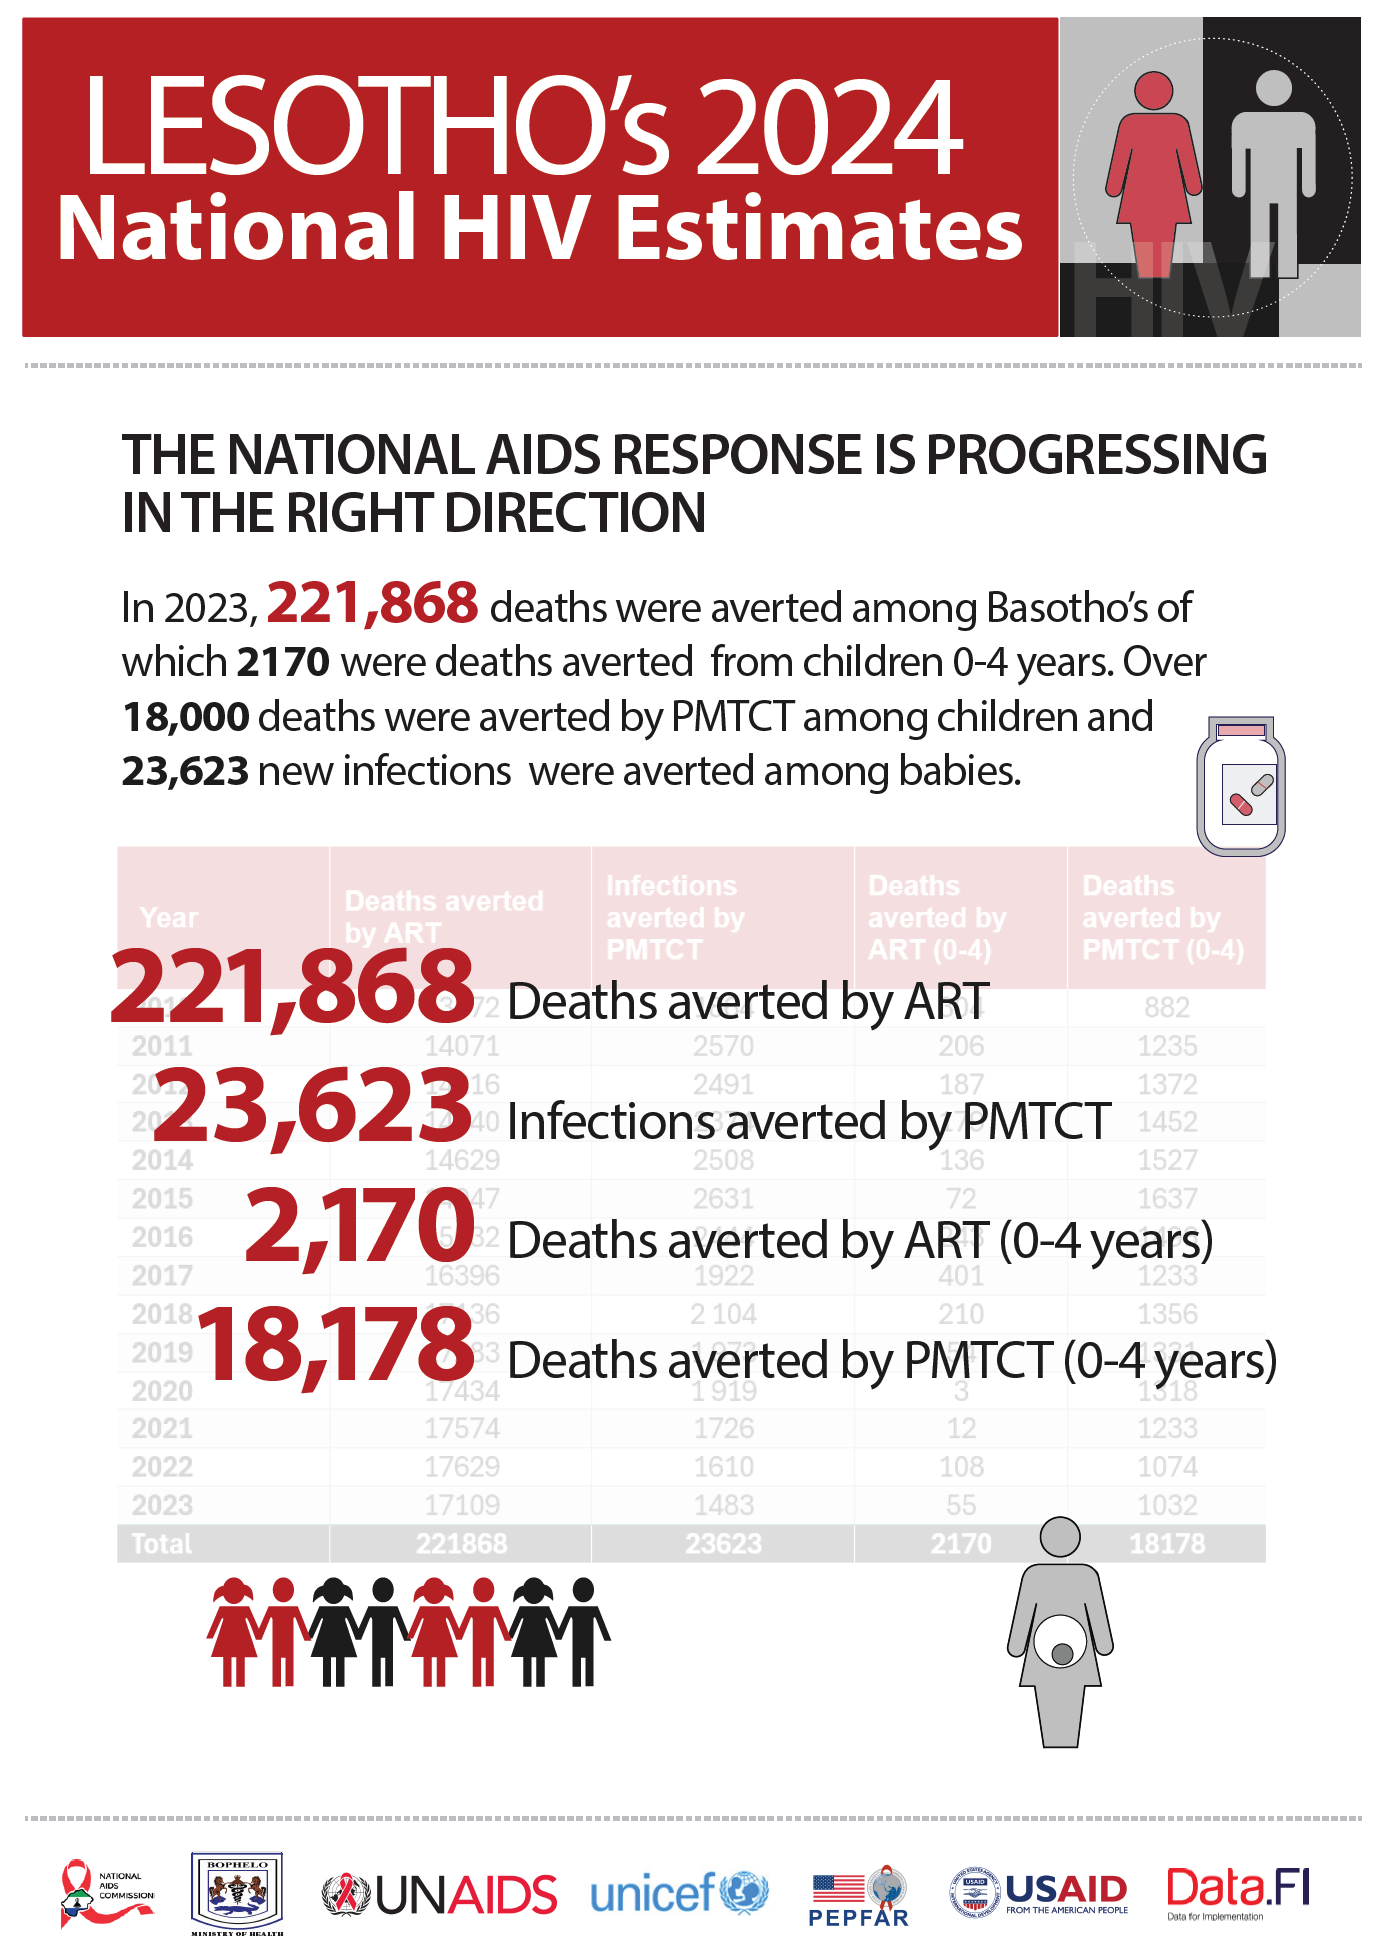
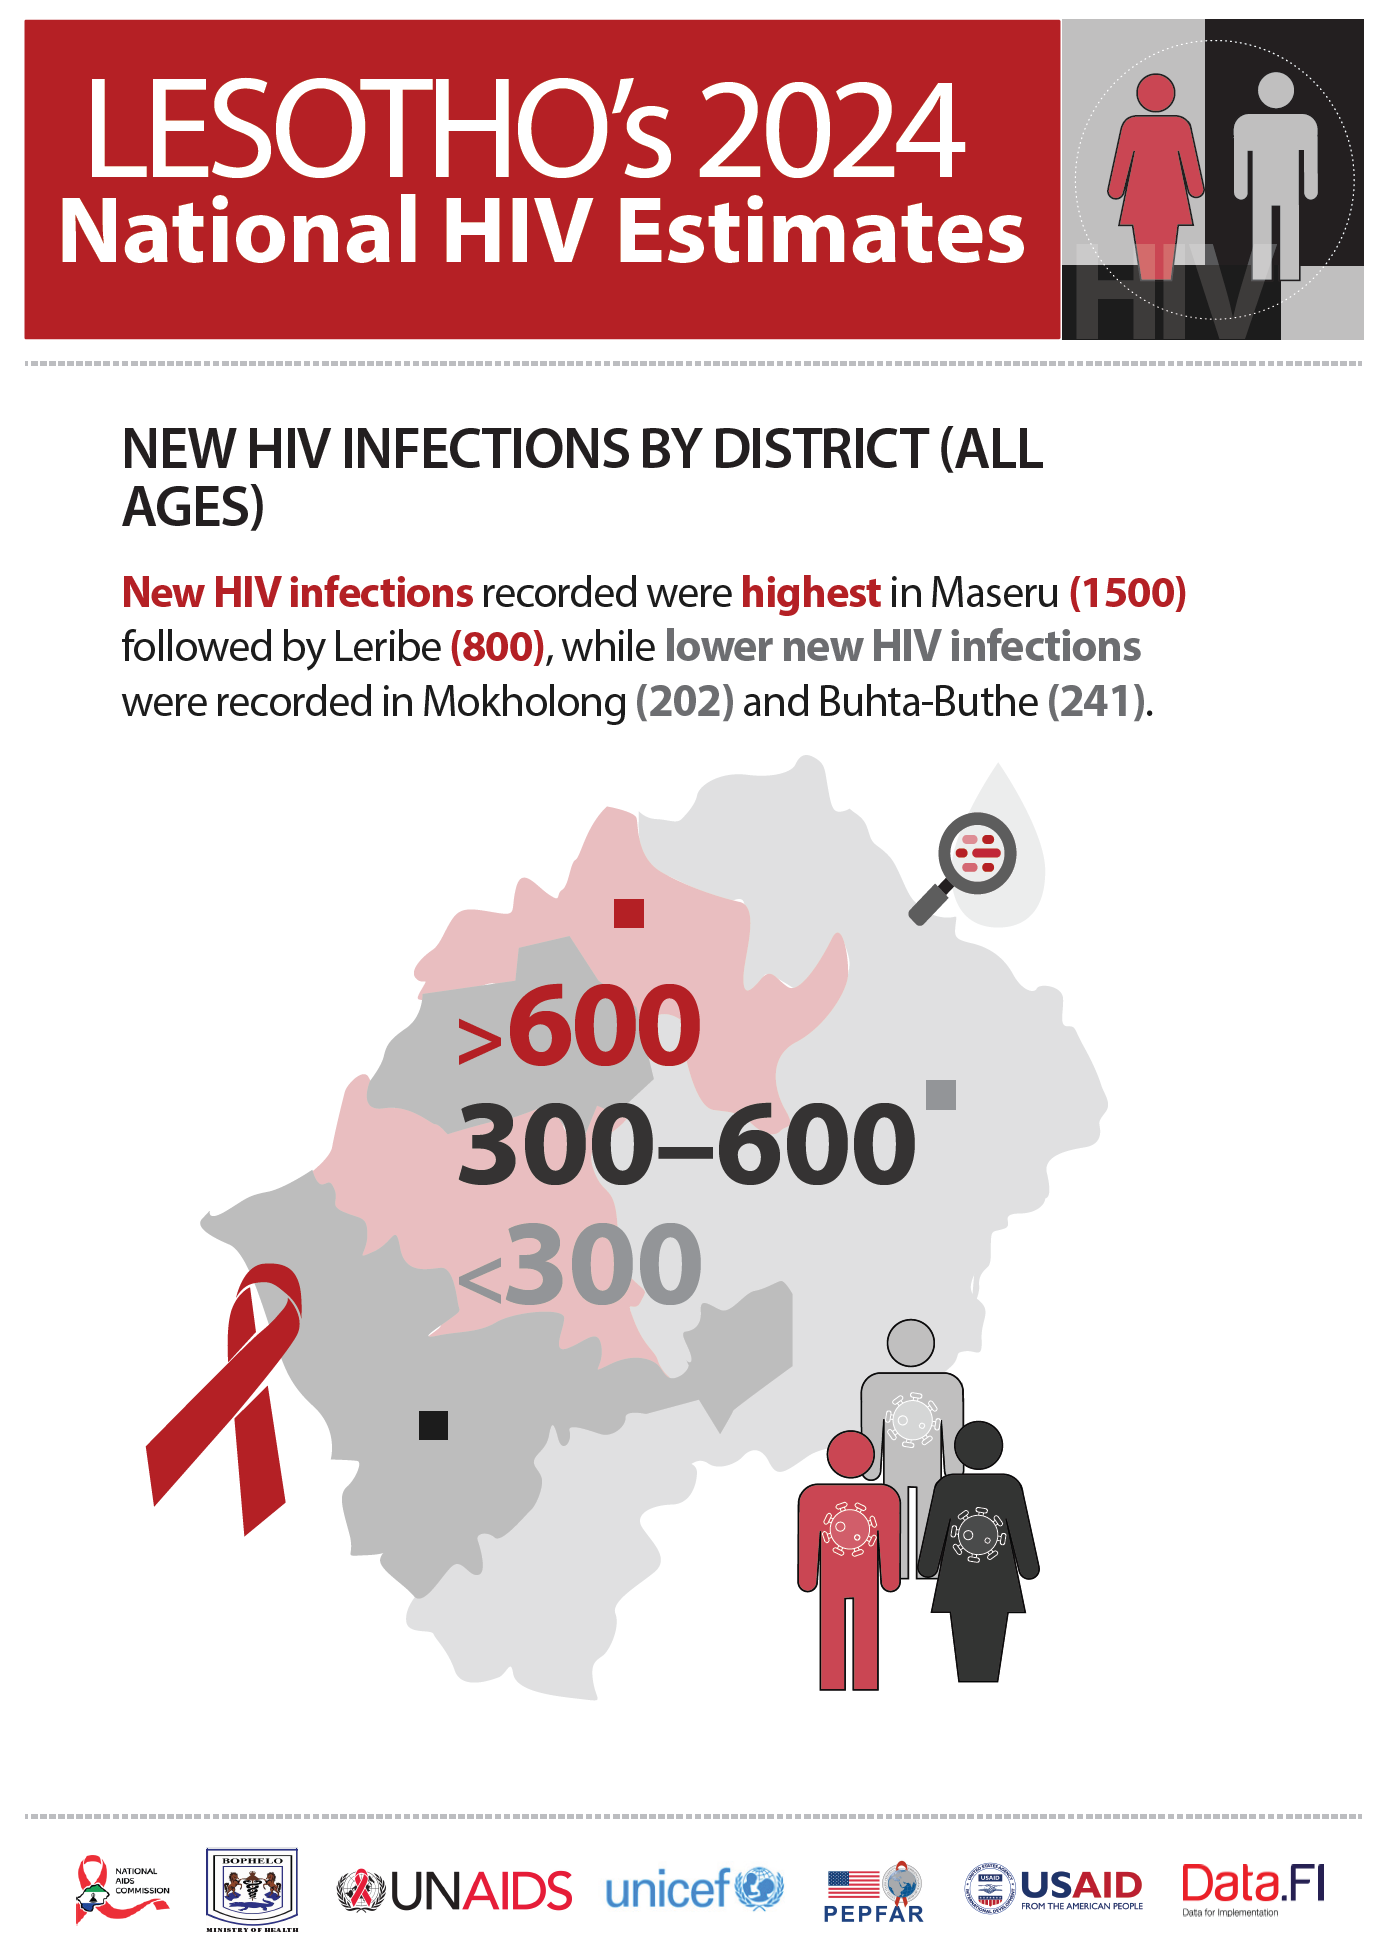
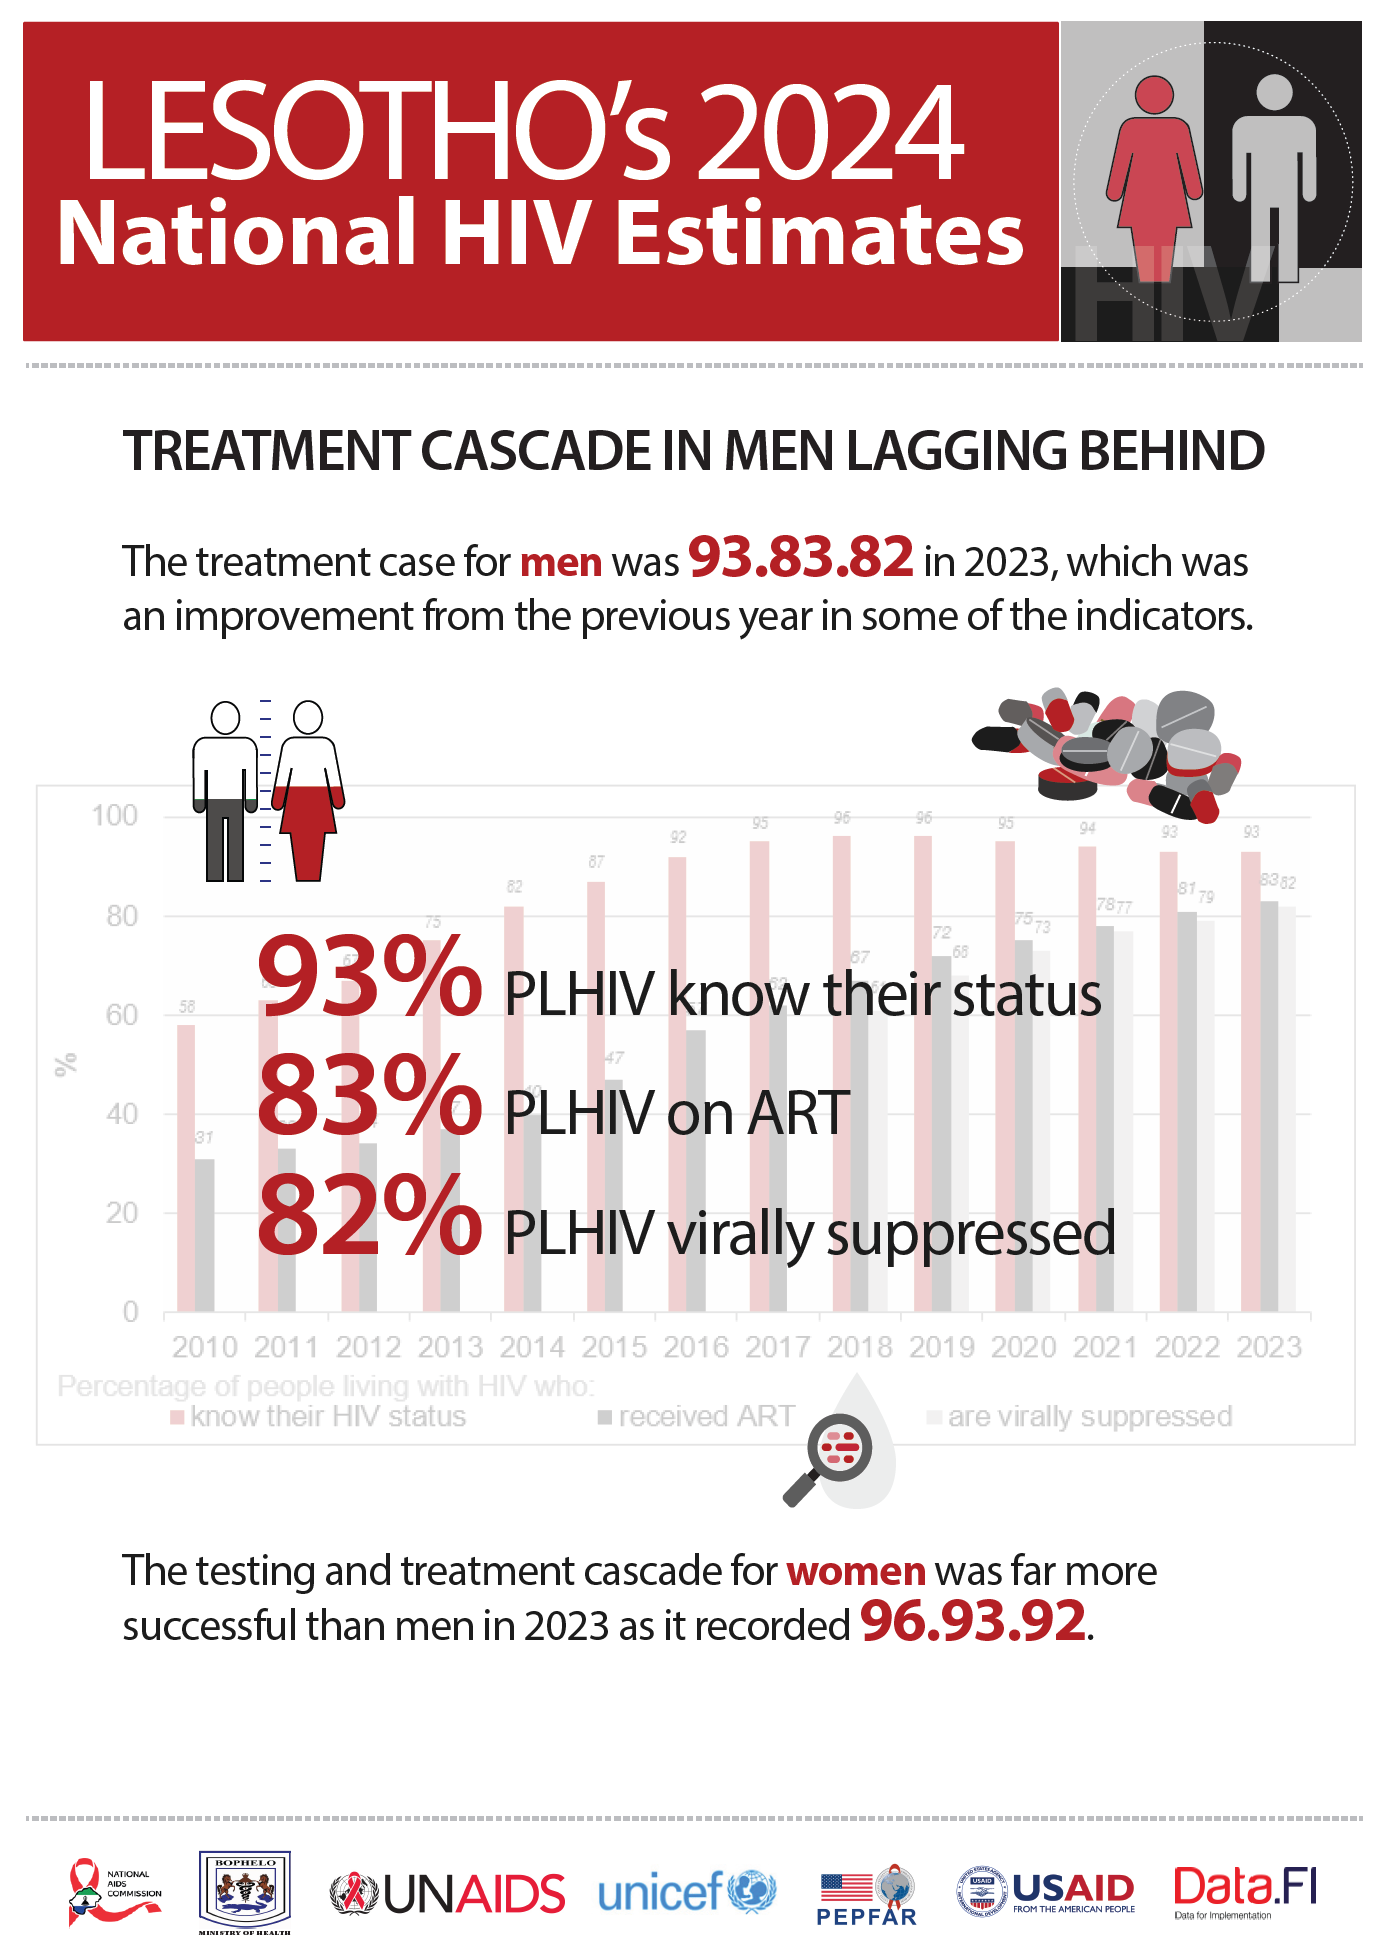
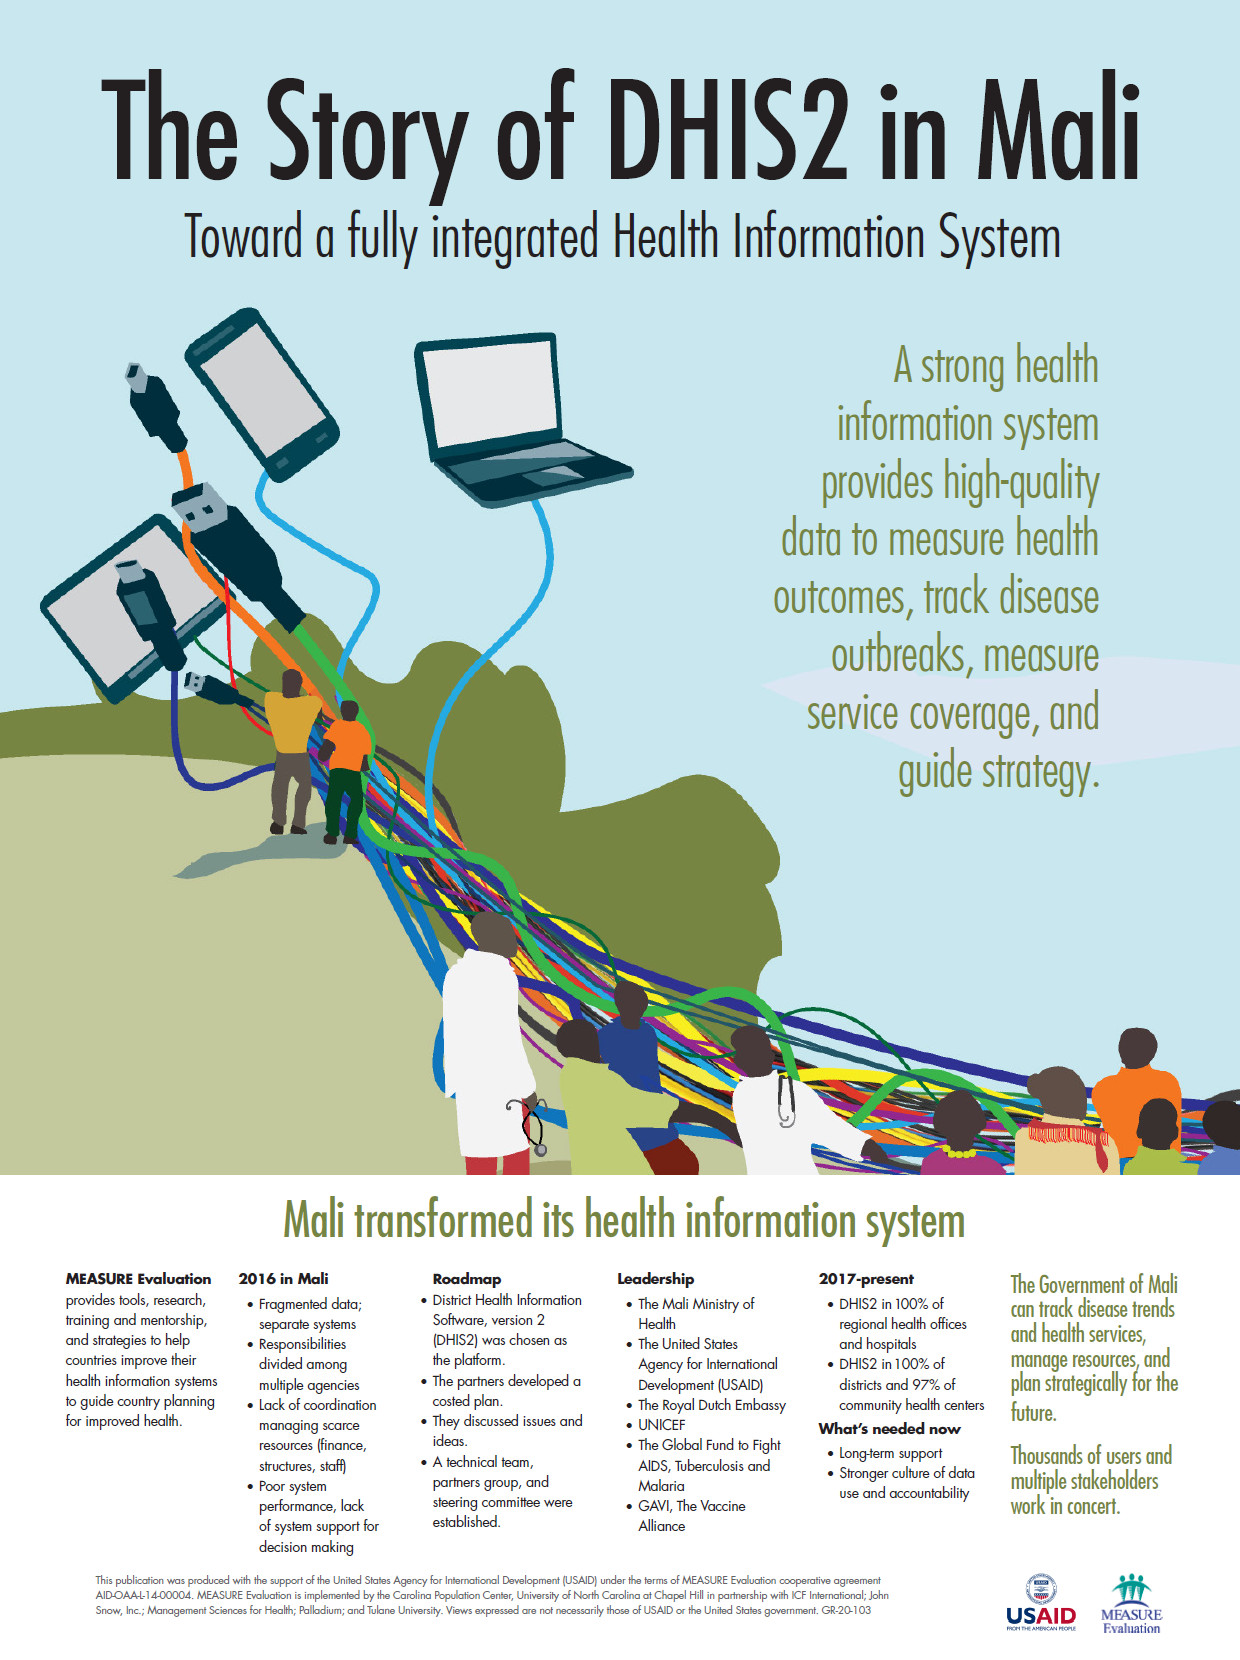
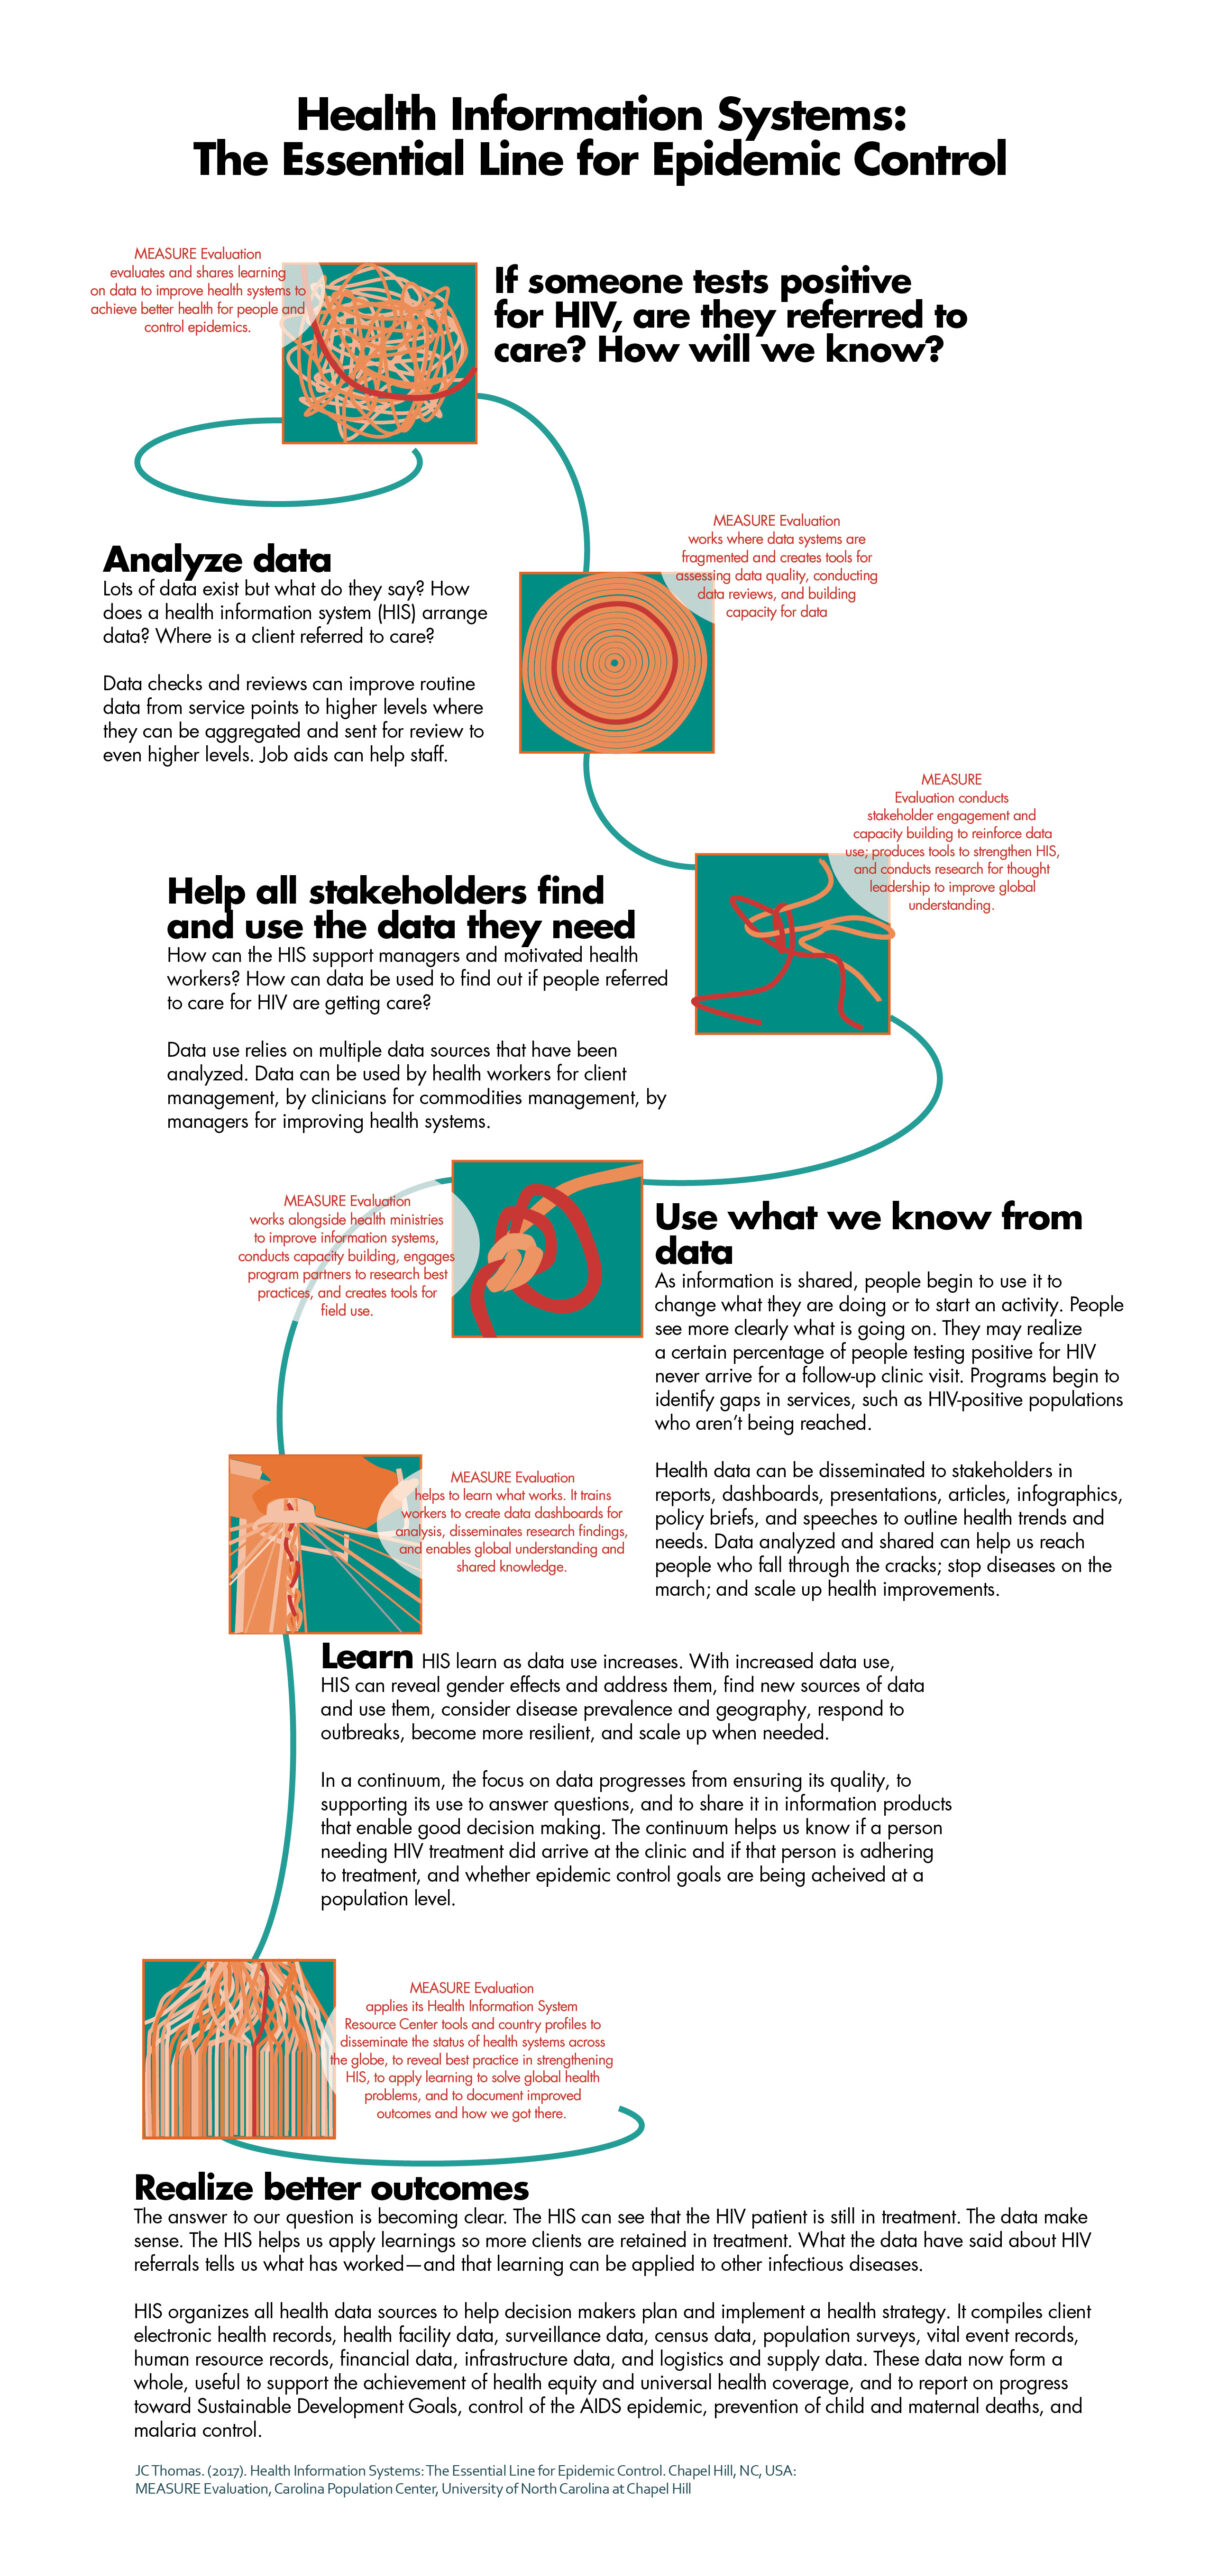
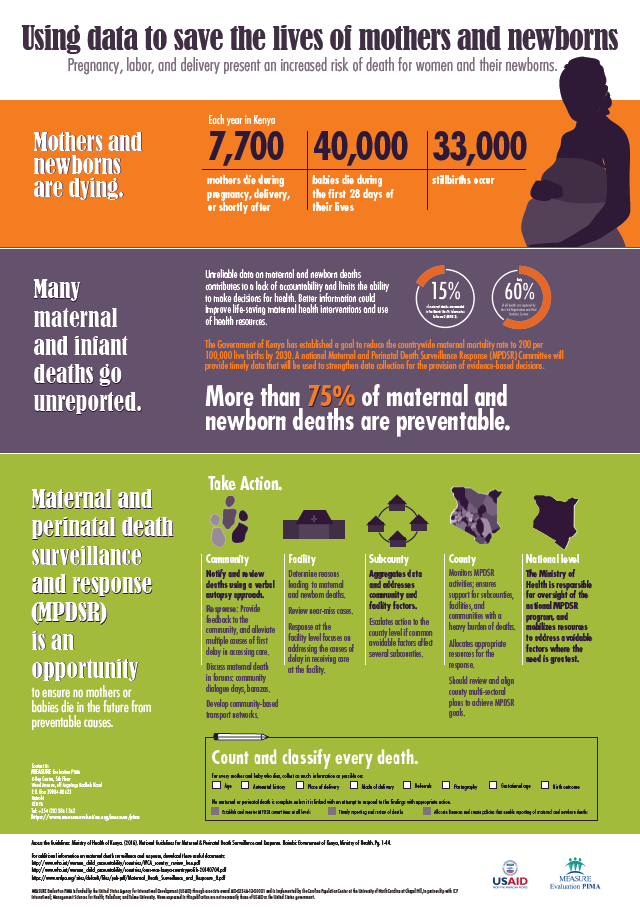
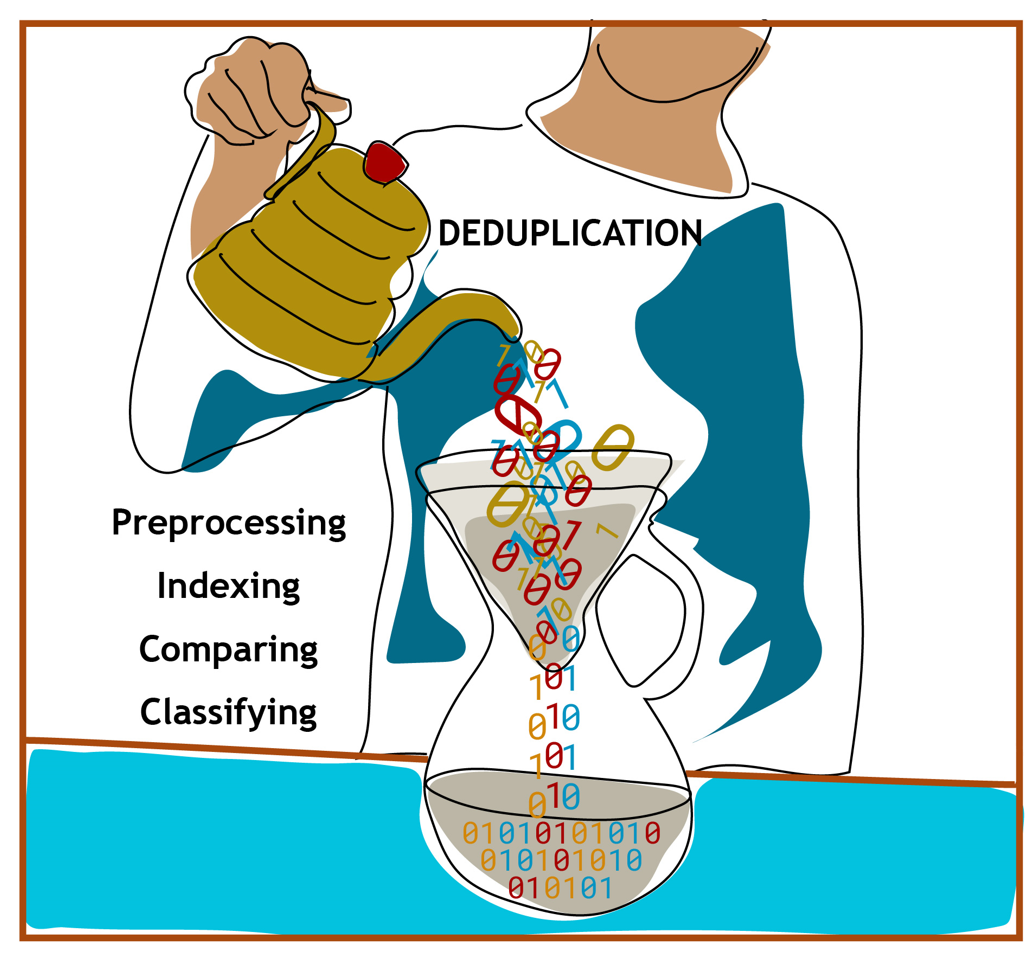
We conceptualize and design timelines, flowcharts, graphs, process maps, or diagrams that are easy to interpret at a glance.
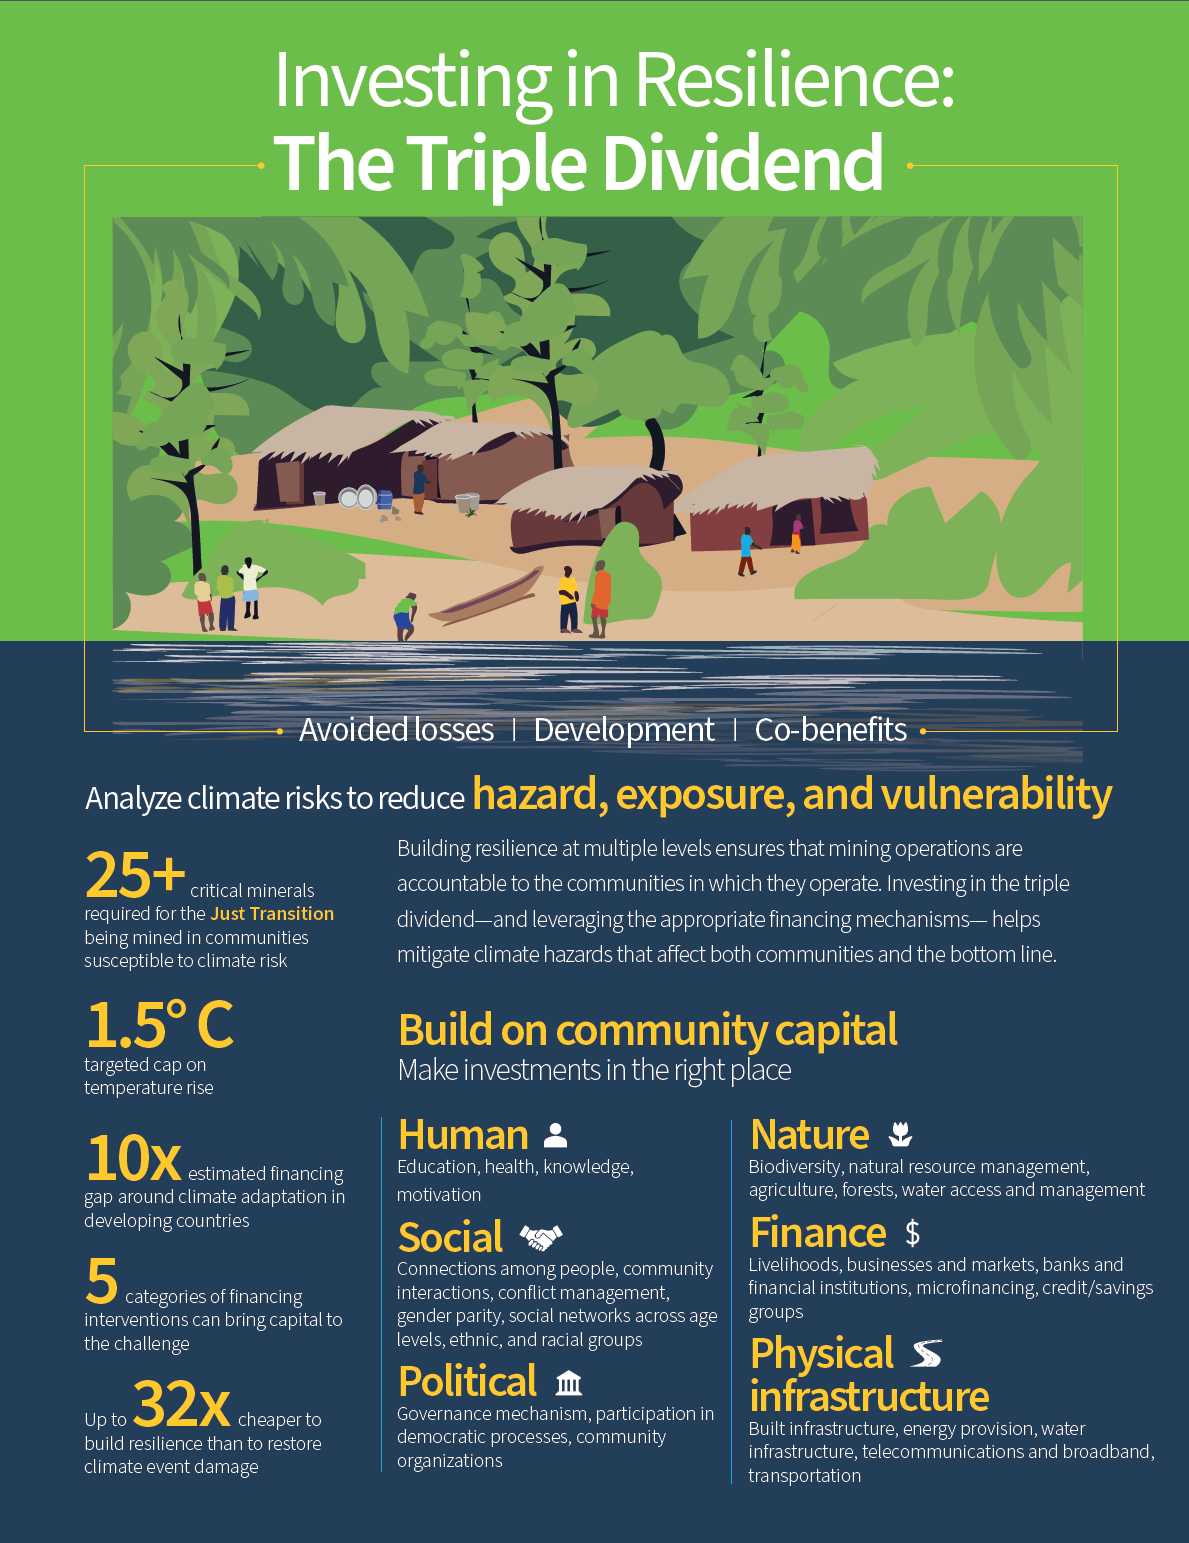
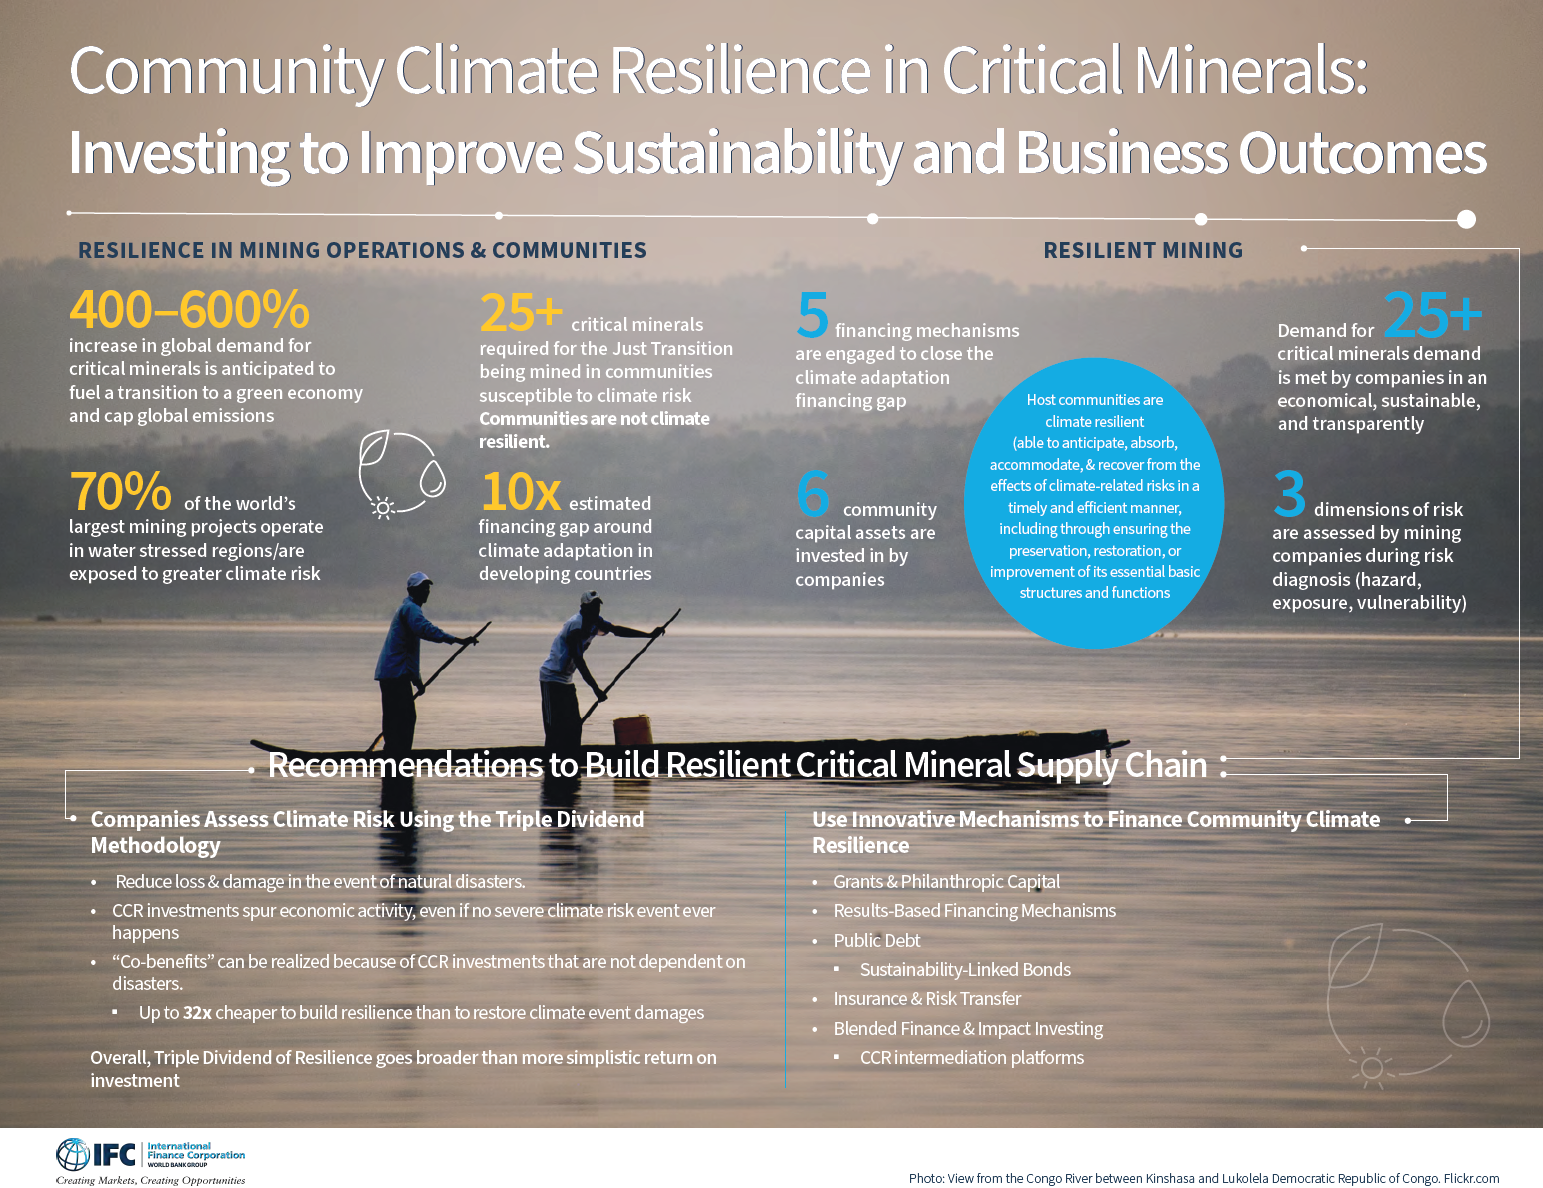
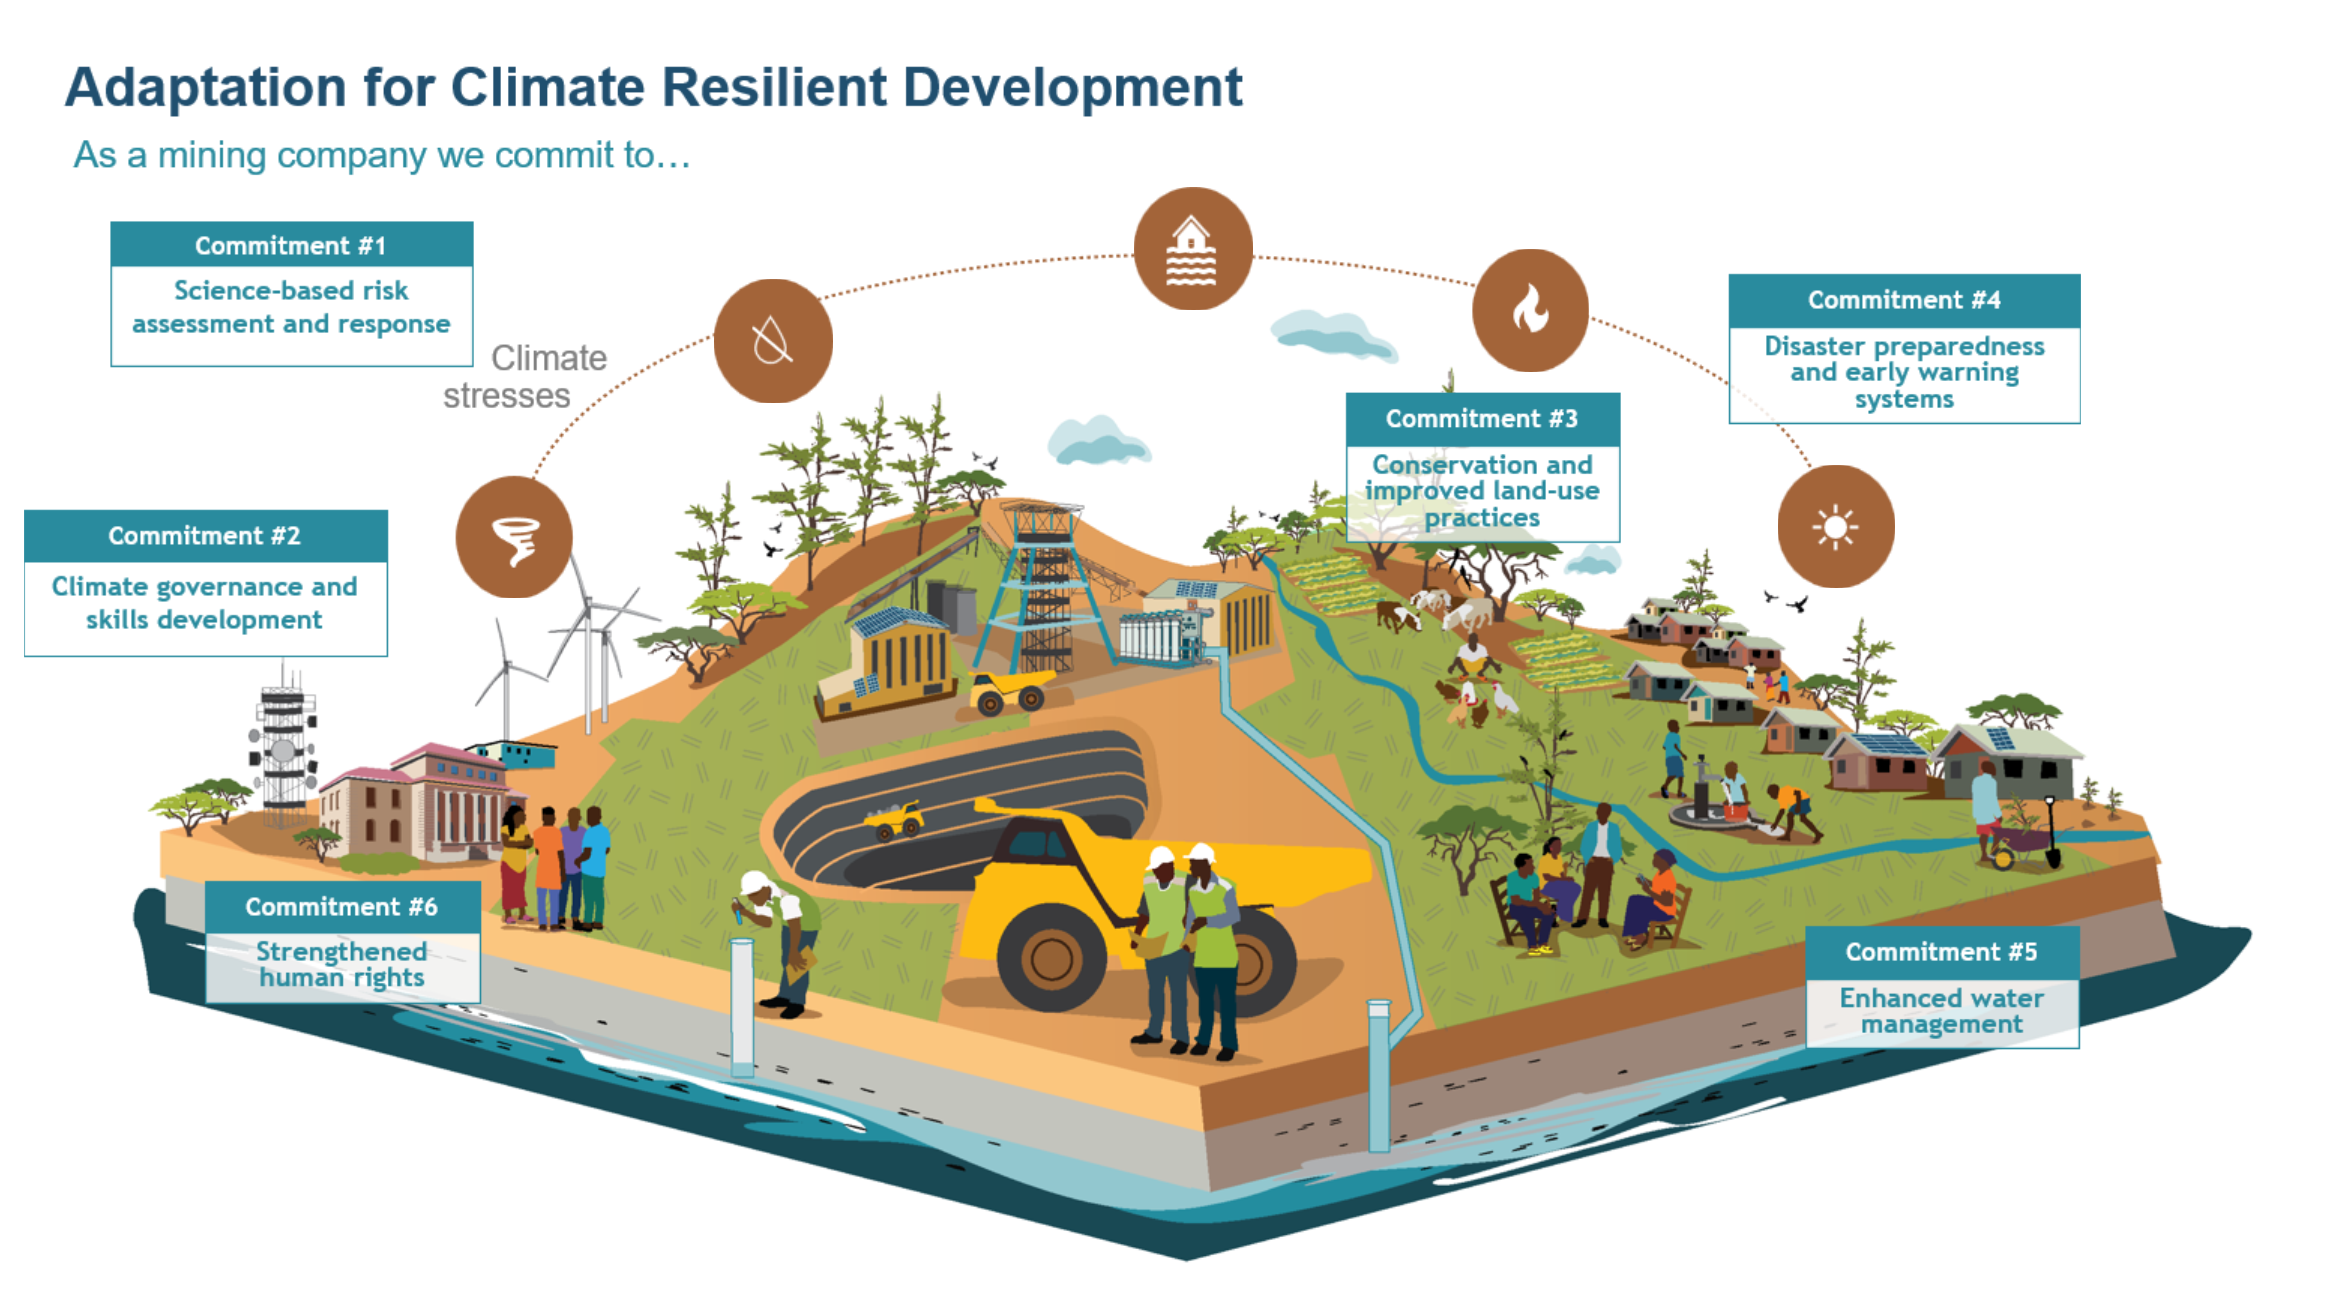
Sometimes clients request we create multiple visual approaches for consideration by colleagues and partners. Below is an example of three diverse visual approaches I proposed to a client seeking to convey the steps involved in developing resiliency to climate change. Balancing the need to convey meaning visually, while providing data, was key.
Click on any of the images shown below to see larger versions. By clicking on the arrow at right, you can scroll through them to see more detail.